Bed, Bath and Beyond 2007 Annual Report Download - page 5
Download and view the complete annual report
Please find page 5 of the 2007 Bed, Bath and Beyond annual report below. You can navigate through the pages in the report by either clicking on the pages listed below, or by using the keyword search tool below to find specific information within the annual report.-
 1
1 -
 2
2 -
 3
3 -
 4
4 -
 5
5 -
 6
6 -
 7
7 -
 8
8 -
 9
9 -
 10
10 -
 11
11 -
 12
12 -
 13
13 -
 14
14 -
 15
15 -
 16
16 -
17
-
18
-
19
-
20
-
21
-
22
-
23
-
24
-
25
-
26
-
27
-
28
-
29
-
30
-
31
-
32
-
33
-
34
-
35
-
36
-
37
-
38
-
39
-
40
-
41
-
42
-
43
-
44
-
45
-
46
-
47
-
48
-
49
-
50
-
51
-
52
-
53
-
54
-
55
-
56
-
57
-
58
-
59
-
60
-
61
-
62
-
63
-
64
-
65
-
66
-
67
-
68
 |
 |
BED BATH& BEYOND ANNUAL REPORT 2007
3
MANAGEMENT’S DISCUSSION AND ANALYSIS OF FINANCIAL CONDITION AND RESULTS OF OPERATIONS
OVERVIEW
Bed Bath & Beyond Inc. and subsidiaries (the “Company”) is a chain of retail stores, operating under the names Bed Bath &
Beyond (“BBB”), Christmas Tree Shops (“CTS”), Harmon and Harmon Face Values (“Harmon”) and buybuy BABY. The Company
sells a wide assortment of merchandise principally including domestics merchandise and home furnishings as well as food,
giftware, health and beauty care items and infant and toddler merchandise. The Company’s objective is to be a customer’s first
choice for products and services in the categories offered, in the markets in which the Company operates.
The Company’s strategy is to achieve this objective through excellent customer service, an extensive breadth and depth of assort-
ment, everyday low prices, introduction of new merchandising offerings and development of its infrastructure.
Operating in the highly competitive retail industry, the Company, along with other retail companies, is influenced by a number of
factors including, but not limited to, general economic conditions including the housing market and fuel costs, unusual weather
patterns, consumer preferences and spending habits, competition from existing and potential competitors, and the ability to find
suitable locations at acceptable occupancy costs to support the Company’s expansion program.
The Company’s fiscal 2007 results reflect the challenges presented by certain macroeconomic conditions, including the economic
slowdown, in general; specific issues related to the housing and mortgage industries; and a heightened promotional environment.
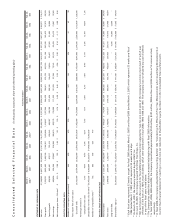
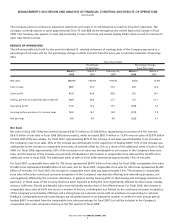
The following represents an overview of the Company’s financial performance for the periods indicated:
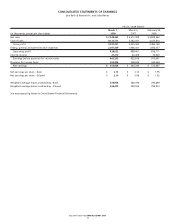
• Net sales in fiscal 2007 (fifty-two weeks) increased approximately 6.5% to $7.049 billion; net sales in fiscal 2006 (fifty-three
weeks) increased approximately 13.9% to $6.617 billion over net sales of $5.810 billion in fiscal 2005 (fifty-two weeks).
• Comparable store sales for fiscal 2007 increased by approximately 1.0% as compared with an increase of approximately
4.9% and 4.6% in fiscal 2006 and 2005, respectively. Comparable store sales percentages are calculated based on an equiva-
lent number of weeks for each annual period.
A store is considered a comparable store when it has been open for twelve full months following its grand opening period
(typically four to six weeks). Stores relocated or expanded are excluded from comparable store sales if the change in square
footage would cause meaningful disparity in sales over the prior period. In the case of a store to be closed, such store’s sales
are not considered comparable once the store closing process has commenced. buybuy BABY is excluded from the compara-
ble store sales percentage for fiscal 2007, but will be included in the Company’s comparable store sales calculation starting
in the first quarter of fiscal 2008.
• Gross profit for fiscal 2007 was $2.925 billion or 41.5% of net sales compared with $2.835 billion or 42.8% of net sales
for fiscal 2006 and $2.486 billion or 42.8% of net sales for fiscal 2005.
• Selling, general and administrative expenses for fiscal 2007 were $2.087 billion or 29.6% of net sales compared with
$1.946 billion or 29.4% of net sales for fiscal 2006 and $1.607 billion or 27.7% of net sales for fiscal 2005. Fiscal 2006
includes a non-recurring pre-tax charge of $30 million related to the Company’s remediation program intended to
protect its employees from certain adverse tax consequences arising pursuant to Internal Revenue Code Section 409A.
• The effective tax rate was 35.0%, 36.3% and 37.4% for fiscal years 2007, 2006 and 2005, respectively.
• Net earnings for the fiscal year (fifty-two weeks) ended March 1, 2008 were $2.10 per diluted share ($562.8 million),
compared to fiscal 2006 (fifty-three weeks) net earnings of $2.09 per diluted share ($594.2 million), which included a
non-recurring charge of approximately $.07 per diluted share, and fiscal 2005 (fifty-two weeks) net earnings of $1.92 per
diluted share ($572.8 million). The increase in net earnings per diluted share for fiscal 2007 includes the impact of the
Company’s repurchases of its common stock.
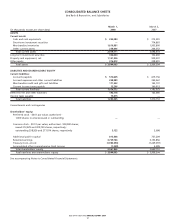
During fiscal 2007, 2006 and 2005 the Company’s capital expenditures were $358.2 million, $317.5 million and $220.4 million.
Included in fiscal 2007’s capital expenditures were costs associated with a new distribution center and a new E-service fulfillment
center to support the Company’s growth.
On March 22, 2007, the Company acquired buybuy BABY, a retailer of infant and toddler merchandise for approximately
$67 million (net of cash acquired) and repayment of debt of approximately $19 million. The acquisition did not have a material
effect on its consolidated results of operations and financial condition for fiscal 2007.
Also, in December 2007, the Company opened its first international store in Canada and is actively pursuing its expansion
opportunities in Canada.