Bed, Bath and Beyond 2007 Annual Report Download - page 15
Download and view the complete annual report
Please find page 15 of the 2007 Bed, Bath and Beyond annual report below. You can navigate through the pages in the report by either clicking on the pages listed below, or by using the keyword search tool below to find specific information within the annual report.-
 1
1 -
2
-
3
-
4
-
 5
5 -
 6
6 -
 7
7 -
 8
8 -
 9
9 -
 10
10 -
 11
11 -
 12
12 -
 13
13 -
 14
14 -
 15
15 -
 16
16 -
 17
17 -
 18
18 -
 19
19 -
 20
20 -
 21
21 -
 22
22 -
 23
23 -
 24
24 -
 25
25 -
26
-
27
-
28
-
29
-
30
-
31
-
32
-
33
-
34
-
35
-
36
-
37
-
38
-
39
-
40
-
41
-
42
-
43
-
44
-
45
-
46
-
47
-
48
-
49
-
50
-
51
-
52
-
53
-
54
-
55
-
56
-
57
-
58
-
59
-
60
-
61
-
62
-
63
-
64
-
65
-
66
-
67
-
68
 |
 |

BED BATH& BEYOND ANNUAL REPORT 2007
13
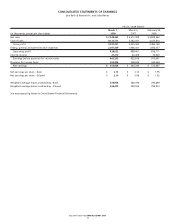
FISCAL YEAR ENDED
March 1, March 3, February 25,
(in thousands, except per share data) 2008 2007 2006
Net sales $ 7,048,942 $ 6,617,429 $ 5,809,562
Cost of sales 4,123,711 3,782,027 3,323,814
Gross profit 2,925,231 2,835,402 2,485,748
Selling, general and administrative expenses 2,087,209 1,946,001 1,606,577
Operating profit 838,022 889,401 879,171
Interest income 27,210 43,478 35,920
Earnings before provision for income taxes 865,232 932,879 915,091
Provision for income taxes 302,424 338,635 342,244
Net earnings 562,808 $ 594,244 $ 572,847
Net earnings per share - Basic $ 2.13 $ 2.12 $ 1.95
Net earnings per share - Diluted $ 2.10 $ 2.09 $ 1.92
Weighted average shares outstanding - Basic 264,824 280,199 293,899
Weighted average shares outstanding - Diluted 268,409 284,956 298,973
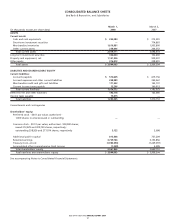
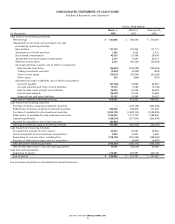
See accompanying Notes to Consolidated Financial Statements.
CONSOLIDATED STATEMENTS OF EARNINGS
Bed Bath & Beyond Inc. and Subsidiaries
$