Bed, Bath and Beyond 2007 Annual Report Download - page 16
Download and view the complete annual report
Please find page 16 of the 2007 Bed, Bath and Beyond annual report below. You can navigate through the pages in the report by either clicking on the pages listed below, or by using the keyword search tool below to find specific information within the annual report.-
 1
1 -
2
-
3
-
4
-
5
-
 6
6 -
 7
7 -
 8
8 -
 9
9 -
 10
10 -
 11
11 -
 12
12 -
 13
13 -
 14
14 -
 15
15 -
 16
16 -
 17
17 -
 18
18 -
 19
19 -
 20
20 -
 21
21 -
 22
22 -
 23
23 -
 24
24 -
 25
25 -
 26
26 -
27
-
28
-
29
-
30
-
31
-
32
-
33
-
34
-
35
-
36
-
37
-
38
-
39
-
40
-
41
-
42
-
43
-
44
-
45
-
46
-
47
-
48
-
49
-
50
-
51
-
52
-
53
-
54
-
55
-
56
-
57
-
58
-
59
-
60
-
61
-
62
-
63
-
64
-
65
-
66
-
67
-
68
 |
 |

BED BATH& BEYOND ANNUAL REPORT 2007
14
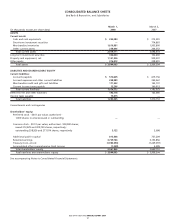
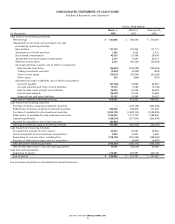
CONSOLIDATED STATEMENTS OF SHAREHOLDERS’ EQUITY
Bed Bath & Beyond Inc. and Subsidiaries
ACCUMULATED
ADDITIONAL TREASURY OTHER
COMMON STOCK PAID-IN RETAINED STOCK COMPREHENSIVE
(in thousands) SHARES AMOUNT CAPITAL EARNINGS SHARES AMOUNT INCOME (LOSS) TOTAL
Balance at February 26, 2005 302,825 $3,028 $491,508)$2,059,377)) (8,762) $ (350,151) $ —)$2,203,762)
Net earnings 572,847)) 572,847)
Shares sold under employee
stock option plans,
including tax benefit 2,300 24 57,622)57,646)
Issuance of restricted shares, net 1,031 10 (10) —)
Stock-based compensation
expense 26,439)26,439)
Repurchase of common stock,
including fees (16,404) (598,244) (598,244)
Balance at February 25, 2006 306,156 3,062 575,559 2,632,224)) (25,166) (948,395) —)2,262,450)
Net earnings 594,244)) 594,244)
Shares sold under employee
stock option plans,
including tax benefit 2,603 26 61,628 61,654)
Issuance of restricted shares, net 991 10 (10) )—)
Stock-based compensation
expense, net 61,744 61,744)
Repurchase of common stock,
including fees (7,510) (301,002) (301,002)
Adoption of SAB 108 38,288)(72,612) (34,324)
Adoption of SFAS No. 158 4,385)4,385)
Balance at March 3, 2007 309,750 3,098 737,209 3,153,856)(32,676) (1,249,397) 4,385 2,649,151)
Adoption of FIN 48 13,102)13,102)
Comprehensive Income (Loss):
Net Earnings 562,808)562,808)
Temporary impairment of auction
rate securities, net of taxes (4,516) (4,516)
Pension adjustment, net of taxes (736) (736)
Currency translation adjustment (171) (171)
Comprehensive Income 557,385)
Shares sold under employee
stock option plans,
including tax benefit 1,463 14 31,367 31,381)
Issuance of restricted shares, net 1,016 10 (10) —)
Stock-based compensation
expense, net 45,002 45,002)
Repurchase of common stock,
including fees (20,633) (734,193) (734,193)
Balance at March 1, 2008 312,229 $3,122 $ 813,568 $ 3,729,766)(53,309) $(1,983,590) $(1,038) $2,561,828)
See accompanying Notes to Consolidated Financial Statements.