Bed, Bath and Beyond 2007 Annual Report Download - page 33
Download and view the complete annual report
Please find page 33 of the 2007 Bed, Bath and Beyond annual report below. You can navigate through the pages in the report by either clicking on the pages listed below, or by using the keyword search tool below to find specific information within the annual report.-
 1
1 -
2
-
3
-
4
-
5
-
6
-
7
-
8
-
9
-
10
-
11
-
12
-
13
-
14
-
15
-
16
-
17
-
18
-
19
-
20
-
21
-
22
-
 23
23 -
 24
24 -
 25
25 -
 26
26 -
 27
27 -
 28
28 -
 29
29 -
 30
30 -
 31
31 -
 32
32 -
 33
33 -
 34
34 -
 35
35 -
 36
36 -
 37
37 -
 38
38 -
 39
39 -
 40
40 -
 41
41 -
 42
42 -
 43
43 -
44
-
45
-
46
-
47
-
48
-
49
-
50
-
51
-
52
-
53
-
54
-
55
-
56
-
57
-
58
-
59
-
60
-
61
-
62
-
63
-
64
-
65
-
66
-
67
-
68
 |
 |

BED BATH& BEYOND ANNUAL REPORT 2007
31
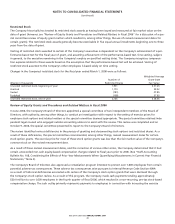
prices on certain stock option grants so as to protect them from certain potential adverse tax consequences. No executive officer
received such payments. The Company believes it is likely the Company will recoup a substantial portion of the anticipated cash
outlay over the next several years through higher proceeds from future stock option exercises, although this recovery would not
flow through the income statement.
The Company continues to cooperate with the informal inquiry of the SEC regarding the Company’s stock option grant practices.
The United States Attorney’s Office for the District of New Jersey has concluded its inquiry with respect to matters arising out of
and related to the Company’s historical stock option grants and procedures and related matters and has indicated it will take no
further action related to this matter.
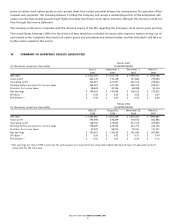
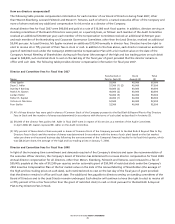
14. SUMMARY OF QUARTERLY RESULTS (UNAUDITED)
FISCAL 2007
(in thousands, except per share data) QUARTER ENDED
June 2, September 1, December 1, March 1,
2007 2007 2007 2008
Net sales $ 1,553,293 $ 1,767,716 $ 1,794,747 $ 1,933,186
Gross profit 646,109 732,158 747,866 799,098
Operating profit 154,391 221,037 203,152 259,442
Earnings before provision for income taxes 164,281 227,754 208,120 265,077
Provision for income taxes 59,634 80,746 69,888 92,156
Net earnings $ 104,647 $ 147,008 $ 138,232 $ 172,921
EPS-Basic (1) $ 0.38 $ 0.55 $ 0.53 $ 0.67
EPS-Diluted (1) $ 0.38 $ 0.55 $ 0.52 $ 0.66
FISCAL 2006
(in thousands, except per share data) QUARTER ENDED
May 27, August 26, November 25, March 3,
2006 2006 2006 2007
Net sales $ 1,395,963 $ 1,607,239 $ 1,619,240 $ 1,994,987
Gross profit 590,098 678,249 704,073 862,982
Operating profit 148,750 219,622 211,134 309,895
Earnings before provision for income taxes 158,409 229,550 221,777 323,143
Provision for income taxes 57,978 84,015 79,341 117,301
Net earnings $ 100,431 $ 145,535 $ 142,436 $ 205,842
EPS-Basic (1) $ 0.36 $ 0.52 $ 0.51 $ 0.74
EPS-Diluted (1) $ 0.35 $ 0.51 $ 0.50 $ 0.72
(1) Net earnings per share (“EPS”) amounts for each quarter are required to be computed independently and may not equal the amount
computed for the total year.