Bed, Bath and Beyond 2007 Annual Report Download - page 7
Download and view the complete annual report
Please find page 7 of the 2007 Bed, Bath and Beyond annual report below. You can navigate through the pages in the report by either clicking on the pages listed below, or by using the keyword search tool below to find specific information within the annual report.-
 1
1 -
 2
2 -
 3
3 -
 4
4 -
 5
5 -
 6
6 -
 7
7 -
 8
8 -
 9
9 -
 10
10 -
 11
11 -
 12
12 -
 13
13 -
 14
14 -
 15
15 -
 16
16 -
 17
17 -
 18
18 -
19
-
20
-
21
-
22
-
23
-
24
-
25
-
26
-
27
-
28
-
29
-
30
-
31
-
32
-
33
-
34
-
35
-
36
-
37
-
38
-
39
-
40
-
41
-
42
-
43
-
44
-
45
-
46
-
47
-
48
-
49
-
50
-
51
-
52
-
53
-
54
-
55
-
56
-
57
-
58
-
59
-
60
-
61
-
62
-
63
-
64
-
65
-
66
-
67
-
68
 |
 |
BED BATH& BEYOND ANNUAL REPORT 2007
5
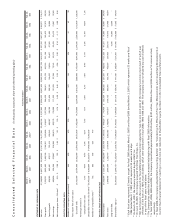
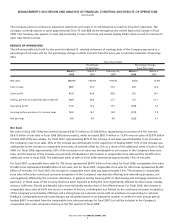
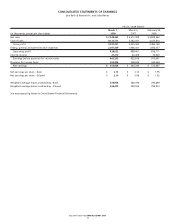
Sales of domestics merchandise accounted for approximately 44%, 46% and 47% of net sales in fiscal 2007, 2006 and 2005,
respectively, of which the Company estimates that bed linens accounted for approximately 14%, 15% and 16% of net sales in
fiscal 2007, 2006 and 2005, respectively. The remaining net sales in fiscal 2007, 2006 and 2005 of 56%, 54% and 53%, respectively,
represented sales of home furnishings and other items. No other individual product category accounted for 10% or more of net
sales during fiscal 2007, 2006 or 2005.
Gross Profit
Gross profit in fiscal 2007, 2006 and 2005 was $2.925 billion or 41.5% of net sales, $2.835 billion or 42.8% of net sales and $2.486
billion or 42.8% of net sales, respectively. The decrease in gross profit between fiscal 2007 and 2006 as a percentage of net sales
was primarily due to an increase in coupon redemptions associated with a heightened promotional environment, an increase in
inventory acquisition costs and the shift in the mix of merchandise sold, as the Company continues to experience a higher percent-
age of sales of home furnishings.
Selling, General and Administrative expenses
Selling, general and administrative expenses (“SG&A”) were $2.087 billion or 29.6% of net sales in fiscal 2007 compared to $1.946
billion or 29.4% of net sales in fiscal 2006. The increase in SG&A as a percentage of net sales is primarily due to a relative increase
in advertising expense as a result of increased distributions of advertising pieces in response to the heightened promotional
environment and a relative increase in occupancy costs and other expenses, partially offset by a relative decrease in payroll and
payroll related items (including a non-recurring pre-tax charge of $30 million in fiscal 2006 related to the Company’s remediation
program intended to protect its employees from certain adverse tax consequences arising pursuant to Internal Revenue Code
Section 409A).
SG&A was $1.946 billion or 29.4% of net sales in fiscal 2006 compared to $1.607 billion or 27.7% of net sales in fiscal 2005.
The increase in SG&A as a percentage of net sales was primarily due to the non-recurring charge referred to above, the expensing
of stock options for twelve months in fiscal 2006 versus six months in fiscal 2005, additional stock-based compensation charges
primarily related to the revised measurement dates, increased legal and accounting charges associated with the stock option
review (see “Review of Equity Grants and Procedures and Related Matters in Fiscal 2006”) and an increase in advertising, which
included higher paper costs and postal rates. Lastly, there were one-time benefits experienced in fiscal 2005, such as settlement
of credit card litigation and certain insurance recoveries, which the Company did not have in fiscal 2006.
Operating Profit
Operating profit for fiscal 2007 was $838.0 million or 11.9% of net sales compared to $889.4 million or 13.4% of net sales in fiscal
2006. The decrease in operating profit as a percentage of net sales was a result of the deleverage in the gross margin and SG&A,
as discussed above.
Operating profit was $889.4 million or 13.4% of net sales in fiscal 2006 compared to $879.2 million or 15.1% of net sales in fiscal
2005. The decrease in operating profit as a percentage of net sales was the result of the deleverage in SG&A, as discussed above.
Interest Income
Interest income in fiscal 2007, 2006 and 2005 was $27.2 million, $43.5 million and $35.9 million, respectively. Interest income
decreased in fiscal 2007 compared to fiscal 2006 primarily as a result of lower cash balances principally due to share repurchase
activity in fiscal 2007. Interest income increased in fiscal 2006 compared to fiscal 2005 primarily due to increases in the Company’s
average investment interest rates as a result of the upward trend in short term interest rates.
Income Taxes
The effective tax rate was 35.0% for fiscal 2007, 36.3% for fiscal 2006 and 37.4% for fiscal 2005. The tax rate for fiscal 2007
included an approximate $21.6 million benefit primarily due to the effective settlement of certain discrete tax items from ongoing
examinations, the recognition of favorable discrete state tax items and from changing the blended state tax rate of deferred
income taxes. The decrease from fiscal 2005 to fiscal 2006 is primarily due to a reduction in the weighted average effective tax
rate resulting from a change in the mix of the business within the taxable jurisdictions in which the Company operates.
The Company expects that Financial Accounting Standards Board (“FASB”) Interpretation No. 48, “Accounting for Uncertainty
in Income Taxes – An Interpretation of FASB Statement No. 109” (“FIN 48”) may, over time, create more volatility in the effective
tax rate from year to year because the Company is required each year to determine whether new information changes the
assessment of both the probability that a tax position will effectively be sustained and the appropriateness of the amount of
recognized benefit.