Bed, Bath and Beyond 2007 Annual Report Download - page 6
Download and view the complete annual report
Please find page 6 of the 2007 Bed, Bath and Beyond annual report below. You can navigate through the pages in the report by either clicking on the pages listed below, or by using the keyword search tool below to find specific information within the annual report.-
 1
1 -
 2
2 -
 3
3 -
 4
4 -
 5
5 -
 6
6 -
 7
7 -
 8
8 -
 9
9 -
 10
10 -
 11
11 -
 12
12 -
 13
13 -
 14
14 -
 15
15 -
 16
16 -
 17
17 -
18
-
19
-
20
-
21
-
22
-
23
-
24
-
25
-
26
-
27
-
28
-
29
-
30
-
31
-
32
-
33
-
34
-
35
-
36
-
37
-
38
-
39
-
40
-
41
-
42
-
43
-
44
-
45
-
46
-
47
-
48
-
49
-
50
-
51
-
52
-
53
-
54
-
55
-
56
-
57
-
58
-
59
-
60
-
61
-
62
-
63
-
64
-
65
-
66
-
67
-
68
 |
 |

BED BATH& BEYOND ANNUAL REPORT 2007
4
The Company plans to continue to expand its operations and invest in its infrastructure to reach its long-term objectives. The
Company currently expects to open approximately 50 to 55 new BBB stores throughout the United States and Canada in fiscal
2008. The Company also expects to open approximately 12 new CTS stores and several buybuy BABY stores as well as continue to
open new Harmon stores.
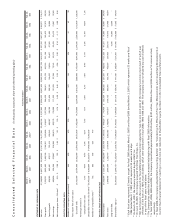
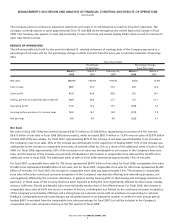
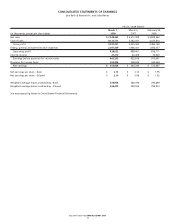
RESULTS OF OPERATIONS
The following table sets forth for the periods indicated (i) selected statement of earnings data of the Company expressed as a
percentage of net sales and (ii) the percentage change in dollar amounts from the prior year in selected statement of earnings
data:
Fiscal Year Ended
Percentage Percentage Change
of Net Sales from Prior Year
March 1, March 3, February 25, March 1, March 3,
2008 2007 2006 2008 2007
Net sales 100.0% 100.0% 100.0% 6.5% 13.9%
Cost of sales 58.5 57.2 57.2 9.0 13.8
Gross profit 41.5 42.8 42.8 3.2 14.1
Selling, general and administrative expenses 29.6 29.4 27.7 7.3 21.1
Operating profit 11.9 13.4 15.1 (5.8) 1.2
Earnings before provision for income taxes 12.3 14.1 15.8 (7.3) 1.9
Net earnings 8.0 9.0 9.9 (5.3) 3.7
Net Sales
Net sales in fiscal 2007 (fifty-two weeks) increased $431.5 million to $7.049 billion, representing an increase of 6.5% over the
$6.617 billion of net sales in fiscal 2006 (fifty-three weeks), which increased $807.9 million or 13.9% over net sales of $5.810 billion
in fiscal 2005 (fifty-two weeks). For fiscal 2007, approximately 82% of the increase in net sales was attributable to an increase in
the Company’s new store sales, 26% of the increase was attributable to the acquisition of buybuy BABY, 15% of the increase was
attributable to the increase in comparable store sales, all partially offset by 23% as a result of the additional week of sales in fiscal
2006. For fiscal 2006, approximately 52% of the increase in net sales was attributable to an increase in the Company’s new store
sales, and the balance of the increase was primarily attributable to the increase in comparable store sales and the benefit of an
additional week in fiscal 2006. The additional week of sales in fiscal 2006 represented approximately 1.6% of net sales.
For fiscal 2007, comparable store sales for 792 stores represented $6.457 billion of net sales; for fiscal 2006, comparable store sales
for 683 stores represented $6.069 billion of net sales; and for fiscal 2005, comparable store sales for 605 stores represented $5.282
billion of net sales. For fiscal 2007, the increase in comparable store sales was approximately 1.0%. The increase in comparable
store sales reflects the continued consumer acceptance of the Company’s merchandise offerings and advertising programs, but
was negatively affected by the economic slowdown, in general, and by issues specific to the housing and mortgage industries in
particular. In those areas of the Country that have been reported as being the most significantly affected by these issues, notably
Arizona, California, Florida and Nevada, sales were noticeably weaker than in less affected areas. For fiscal 2006, the increase in
comparable store sales of 4.9% was due to a number of factors, including but not limited to, the continued consumer acceptance
of the Company’s merchandise offerings and a strong focus on customer service with an emphasis on responding to customer
feedback. Comparable store sales percentages are calculated based on an equivalent number of weeks for each annual period.
buybuy BABY is excluded from the comparable store sales percentage for fiscal 2007, but will be included in the Company’s
comparable store sales calculation starting in the first quarter of fiscal 2008.
MANAGEMENT’S DISCUSSION AND ANALYSIS OF FINANCIAL CONDITION AND RESULTS OF OPERATIONS
(continued)