Advance Auto Parts 2001 Annual Report Download - page 26
Download and view the complete annual report
Please find page 26 of the 2001 Advance Auto Parts annual report below. You can navigate through the pages in the report by either clicking on the pages listed below, or by using the keyword search tool below to find specific information within the annual report.-
 1
1 -
2
-
3
-
4
-
5
-
6
-
7
-
8
-
9
-
10
-
11
-
12
-
13
-
14
-
15
-
 16
16 -
 17
17 -
 18
18 -
 19
19 -
 20
20 -
 21
21 -
 22
22 -
 23
23 -
 24
24 -
 25
25 -
 26
26 -
 27
27 -
 28
28 -
 29
29
 |
 |

46 ADVANCE AUTO PARTS ANNUAL REPORT 2001 ADVANCE AUTO PARTS ANNUAL REPORT 2001 47
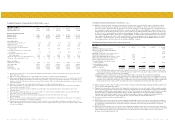
Net Sales
Net sales consist primarily of comparable store sales, new store net
sales, service net sales, net sales to the wholesale dealer network and
finance charges on installment sales. Comparable store sales is
calculated based on the change in net sales starting once a store has
been open for 13 complete accounting periods (each period represents
four weeks). Relocations are included in comparable store sales from the
original date of opening. Each Parts America store that was acquired in
the Western merger and subsequently converted to an Advance Auto
Parts store has been included in the comparable store sales calculation
after 13 complete accounting periods following the completion of its
physical conversion to an Advance Auto Parts store. Additionally, the
stores acquired in the Carport and Discount acquisitions will be
included in the comparable store sales calculation following thirteen
complete accounting periods following their system conversion to the
Advance Auto Parts store system. We do not include net sales from the
Western Auto retail stores in our comparable store sales calculation.
Cost of Sales
Our cost of sales includes merchandise costs and warehouse and
distribution expenses as well as service labor costs of our Western Auto
stores. Gross profit as a percentage of net sales may be affected by
variations in our product mix, price changes in response to competitive
factors and fluctuations in merchandise costs and vendor programs.
We seek to avoid fluctuation in merchandise costs by entering into
long-term purchasing agreements with vendors in exchange for
pricing certainty.
Selling, General and Administrative Expenses
Selling, general and administrative expenses are comprised of store
payroll, store occupancy (including rent), net advertising expenses, other
store expenses and general and administrative expenses, including
salaries and related benefits of corporate employees, administrative
office expenses, data processing, professional expenses and other related
expenses. We lease substantially all of our stores.
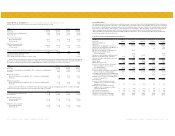
Fiscal 2001 Compared to Fiscal 2000
Net sales for 2001 were $2,517.6 million, an increase of $229.6 million,
or 10.0%, over net sales for 2000. Net sales for the retail segment
increased $252.4 million, or 11.6%. The net sales increase for the retail
segment was due to an increase in comparable store sales of 6.2%, sales
from the recently acquired Discount stores and contributions from new
stores opened within the last year. The comparable store sales increase
of 6.2% was a result of growth in both the DIY and DIFM market
segments, as well as the continued maturation of new stores. Net sales
for the wholesale segment decreased $22.8 million due to a decline in
the number of dealer stores we serviced and lower average sales to
each dealer.
During 2001, we opened 110 new stores (including the 30 net stores
from the Carport acquisition in April 2001), relocated 18 stores and
closed 24 stores. Additionally, we acquired 671 stores in the Discount
acquisition in November 2001 and closed two of these stores in
December 2001, bringing the total number of stores to 2,484. We have
increased the number of our stores participating in our commercial
delivery program to 1,370, primarily as a result of adding 167 Discount
stores with existing commercial delivery programs. Additionally, as of
December 29, 2001, we supplied approximately 470 independent dealers
through the wholesale dealer network.
Gross profit for 2001, excluding non-recurring charges associated
with our supply chain initiatives, was $1,076.0 million, or 42.7% of net
sales, as compared to $895.9 million, or 39.2% of net sales, in 2000.
The change in accounting principle accounted for approximately 220
basis points of the increase with the remaining increase attributable to
positive shifts in product mix. The $8.3 million net gain recorded as a
reduction to cost of sales during the first quarter of 2001 as a result of a
vendor contract settlement was equally offset by higher cost of sales
during the last three quarters of 2001 as a result of the new supplier
contract. The gross profit for the retail segment, excluding non-recurring
charges associated with our supply chain initiatives, was $1,062.0
million, or 43.9% of net sales, for 2001, as compared to $881.0 million,
or 40.7% of net sales, in 2000. The increase in gross profit was
primarily attributable to the change in accounting principle and positive
shifts in product mix.
Selling, general and administrative expenses, before merger and
integration expenses, non-recurring charges and non-cash stock option
compensation expense increased to $947.5 million, or 37.6% of net
sales for 2001, from $801.5 million, or 35.0% of net sales for 2000. The
change in accounting principle accounted for approximately 220 basis
points of the increase with the remaining increase attributable to
increased investment in store staffing and retention initiatives, which
were put in place in the third quarter of 2000, and higher insurance costs
due to adverse changes in the insurance market.
EBITDA (operating income plus depreciation and amortization), as
adjusted for merger and integration expenses, expenses associated with
our supply chain initiatives, restructuring expenses, devaluation of assets
held for sale and non-cash and other employee compensation, was $199.7
million in 2001 or 7.9% of net sales, as compared to $161.9 million, or
7.1% of net sales, in 2000. EBITDA is not intended to represent cash
flow from operations as defined by GAAP, and should not be considered
as a substitute for net income as an indicator of operating performance or
as an alternative to cash flow (as measured by GAAP) as a measure of
liquidity. Our method for calculating EBITDA may differ from similarly
titled measures reported by other companies. We believe certain non-
recurring charges, non-cash and other employee compensation, and
merger and integration expenses, should be eliminated from the EBITDA
calculation to evaluate our operating performance.
Interest expense for 2001 was $61.9 million, or 2.5% of net sales, as
compared to $66.6 million, or 2.9% of net sales, in 2000. The decrease
in interest expense was a result of lower average outstanding borrowings
and a decrease in average interest rates over 2000.
Our effective income tax rate was 39.7% of pre-tax income for 2001,
as compared to 38.8% for 2000. This increase is a result of an increase
in the amount of permanent differences between book and tax reporting
treatment on total income tax expense.
We recorded an extraordinary loss on the extinguishment of debt
during the fourth quarter of 2001. This loss is the result of the write-off
of $3.7 million, net of $2.4 million income taxes, or $0.13 loss per
diluted share, of deferred debt issuance costs associated with refinancing
our credit facility in connection with the Discount acquisition.
We also recorded a loss of $2.1 million, net of $1.4 million of
income taxes, or $0.07 loss per diluted share, for the cumulative effect
of a change in accounting principle during the fourth quarter of 2001.
This change in accounting principle is a result of our change in
accounting method related to certain cooperative advertising funds
received from vendors. This change resulted in the reduction of the cost
of inventory acquired from vendors and the resulting costs of sales.
After one-time expenses, we recorded net income of $11.4 million,
or $0.39 per diluted share, for 2001, as compared to net income of
$19.6 million, or $0.68 per diluted share, for 2000. We recorded certain
one-time expenses in 2001, resulting in a net loss of $0.91 per diluted
share. As a percentage of sales, net income for fiscal 2001 was 0.5% as
compared to 0.8% for 2000.
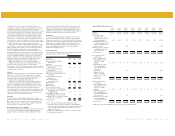
Fiscal 2000 Compared to Fiscal 1999
Net sales for 2000 were $2,288.0 million, an increase of $81.1 million,
or 3.7%, over net sales for 1999. Net sales for the retail segment
increased $149.9 million, or 7.4%. The net sales increase for the retail
segment was due to an increase in the comparable store sales of 4.4%
and contributions from new stores opened within the last year. The
comparable store sales increase of 4.4% was primarily a result of
growth in both the DIY and DIFM market segments, as well as the
continued maturation of new stores and the converted Parts America
stores. Net sales for the wholesale segment decreased 36.3% or $68.8
million due to a decline in the number of dealer stores serviced and
lower average sales to each dealer.
During 2000, we opened 140 new stores, relocated 10 stores and
closed 28 stores, bringing the total retail segment stores to 1,729. At
year end, we had 1,210 stores participating in our commercial delivery
program, a result of adding 116 net stores to the program during 2000.
Additionally, at December 30, 2000, we supplied approximately 590
independent dealers through the wholesale dealer network and our one
store in California.
Gross profit for 2000 was $895.9 million, or 39.2% of net sales, as
compared to $802.8 million, or 36.4% of net sales, in 1999. The gross
profit percentage increased 180 basis points due to the realization of
certain purchasing synergies, fewer product liquidations and a decline
in net sales of the lower margin wholesale segment. Additionally, lower
inventory shrinkage accounted for approximately 60 basis points and
lower logistics costs accounted for approximately 30 basis points of the
increased gross profit margin. The higher shrinkage and logistics costs
in 1999 were related to merchandise conversions and product
liquidations resulting from the Western merger. The gross profit for the
retail segment was $881.0 million, or 40.7% of net sales, for 2000, as
compared to $792.0 million, or 39.3% of net sales, for 1999. During
the fourth quarter of 2000, we recorded a gain as a reduction to cost of
sales of $3.3 million related to a lawsuit against a supplier. The gain
represents actual damages incurred under an interim supply agreement
with the supplier, which provided for higher merchandise costs.
Subsequent to December 30, 2000, we agreed to a cash settlement of
$16.6 million from the supplier. The remainder of the cash settlement
over the originally recorded gain, reduced by higher product costs
incurred under the interim supply agreement and fees and expenses
related to the settlement of the matter, was recognized as an $8.3
million reduction to cost of sales during the first quarter of 2001.
Selling, general and administrative expenses, before impairment of
assets held for sale, integration expenses and non-cash stock option
compensation, increased to $801.5 million, or 35.0% of net sales, for
2000, from $740.5 million, or 33.5% of net sales, for fiscal 1999. The
increase in selling, general and administrative expenses primarily is
attributable to the continued sales decline in the wholesale segment,
which carries lower selling, general and administrative expenses as a
percentage of sales as compared to the retail segment. Additionally, we
incurred higher than expected medical claims as well as higher payroll,
insurance and depreciation expense, partially offset by a decrease in net
advertising costs, as a percentage of sales, as compared to 1999. We
made certain investments in personnel and labor, which we believe are
critical to our long-term success. The increase in depreciation expense
is primarily related to the change in an accounting estimate to reduce
the depreciable lives of certain property and equipment on a
prospective basis.
EBITDA (operating income plus depreciation and amortization), as
adjusted for non-cash and other employee compensation and integration
expenses, was $161.9 million in 2000, or 7.1% of net sales, as
compared to $121.9 million, or 5.5% of net sales, in fiscal 1999.
EBITDA is not intended to represent cash flow from operations as
defined by GAAP and should not be considered as a substitute for net
income as an indicator of operating performance or as an alternative to
cash flow (as measured by GAAP) as a measure of liquidity. Our
method for calculating EBITDA may differ from similarly titled
measures reported by other companies. We believe certain non-
recurring charges, non-cash and other employee compensation, and
merger and integration expenses, should be eliminated from the
EBITDA calculation to evaluate our operating performance.
Interest expense for 2000 was $66.6 million, or 2.9% of net sales, as
compared to $62.8 million, or 2.8% of net sales, for 1999. The increase
in interest expense was a result of an increase in interest rates over
1999, offset by a decrease in net outstanding borrowings. During 2000,
we repurchased $30.6 million of senior subordinated notes on the open
market for $25.0 million.
Our effective income tax rate was 38.8% of pre-tax income for
2000, as compared to 33.2% of pre-tax loss for 1999. This increase is
due to our pre-tax income in 2000 and pre-tax loss in 1999 and the
resulting effect of permanent differences between book and tax
reporting treatment on total income tax expense (benefit). Due to
uncertainties related to the realization of deferred tax assets for certain
net operating loss carryforwards, we recognized additional valuation
allowances of $0.9 million during 2000.
We recorded net income of $19.6 million, or $0.68 per diluted
share, for 2000, as compared to a net loss of $25.3 million, or $0.90 per
diluted share, for 1999. In addition to the items previously discussed,
we also recorded an extraordinary gain related to the early
extinguishment of debt of $2.9 million, or $0.10 per diluted share, net
of $1.8 million provided for income taxes and $0.9 million for the
write-off of associated deferred debt issuance costs. As a percentage of
sales, net income for 2000 was 0.8%, as compared to a net loss of 1.1%
for 1999.