Advance Auto Parts 2001 Annual Report Download - page 23
Download and view the complete annual report
Please find page 23 of the 2001 Advance Auto Parts annual report below. You can navigate through the pages in the report by either clicking on the pages listed below, or by using the keyword search tool below to find specific information within the annual report.-
 1
1 -
2
-
3
-
4
-
5
-
6
-
7
-
8
-
9
-
10
-
11
-
12
-
 13
13 -
 14
14 -
 15
15 -
 16
16 -
 17
17 -
 18
18 -
 19
19 -
 20
20 -
 21
21 -
 22
22 -
 23
23 -
 24
24 -
 25
25 -
 26
26 -
 27
27 -
 28
28 -
 29
29
 |
 |

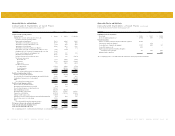
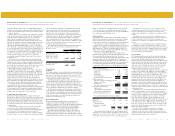
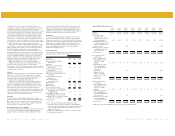
Selected Store Data:
Comparable store sales growth (13) 5.7% 7.8% 10.3% 4.4% 6.2%
Net new stores (14) 165 753 50 112 755
Number of stores, end of period 814 1,567 1,617 1,729 2,484
Stores with commercial delivery program,
end of period 421 532 1,094 1,210 1,370
Total commercial delivery sales, as a percentage
of total sales 7.4% 8.8% 9.0% 13.4% 13.5%
Total retail store square footage, end of
period (in thousands) 5,857 12,084 12,476 13,325 18,717
Average net retail sales per store (in thousands) (15) $ 1,159 $ 1,270 $ 1,267 $ 1,295 $ 1,346
Average net retail sales per square foot (16) $ 161 $ 172 $ 164 $ 168 $ 175
Balance Sheet Data:
Cash and cash equivalents $ 15,463 $ 36,115 $ 22,577 $ 18,009 $ 18,117
Net working capital 121,140 310,113 355,608 318,583 442,099
Total assets 461,257 1,265,355 1,348,629 1,356,360 1,950,615
Total net debt 95,633 485,476 627,467 582,539 972,368
Total stockholders’ equity 143,548 159,091 133,954 156,271 288,571
(1) Our fiscal year consists of 52 or 53 weeks ending on the Saturday nearest to December 31. All fiscal years presented are 52 weeks except for 1997,
which consisted of 53 weeks.
(2) Represents restocking and handling fees associated with the return of inventory as a result of our supply chain initiatives.
(3) Selling, general and administrative expenses exclude certain non-recurring charges discussed in notes (4), (5), (6), (7), (8), (9) and (10) below. The 1997
amount includes an unusual medical claim that exceeded our stop loss insurance coverage. The pre-tax amount of this claim, net of related increased
insurance costs, was $882. We increased our stop loss coverage effective January 1, 1998 to a level that would provide insurance coverage for a medical
claim of this magnitude.
(4) Represents costs of relocating certain equipment held at facilities closed as a result of our supply chain initiatives.
(5) Represents the devaluation of certain property held for sale, including the $1.6 million charge taken in the first quarter of 2001 and a $10.7 million
charge taken in the fourth quarter of 2001.
(6) Represents expenses incurred in our 1998 recapitalization related primarily to non-recurring bonuses paid to certain employees and to fees for
professional services.
(7) Represents expenses related primarily to lease costs associated with 31 of our stores closed in overlapping markets in connection with the Western
merger and 27 closed as a result of the Discount acquisition.
(8) Represents certain expenses related to the Western merger and integration, conversion of the Parts America stores and the
Discount acquisition.
(9) Reflects our estimate of expenses eliminated after the recapitalization that related primarily to compensation and other benefits of our chairman,
who prior to our recapitalization was our principal stockholder.
(10) Represents non-cash compensation expenses related to stock options granted to certain of our employees, including a non-recurring charge of $8.6
million in the fourth quarter of 2001 related to variable provisions of our stock option plans that were in place when we were a private company, and that
have since been eliminated.
40 ADVANCE AUTO PARTS ANNUAL REPORT 2001 ADVANCE AUTO PARTS ANNUAL REPORT 2001 41
Consolidated Statement of Operations Data for Fiscal Year(1): (continued)
(11) EBITDA, as adjusted, represents operating income plus depreciation and amortization, non-cash and other employee compensation expenses
and certain non-recurring charges as scheduled below, included in operating income. EBITDA, as adjusted, is not intended to represent cash
flow from operations as defined by GAAP, and should not be considered as a substitute for net income as an indicator of operating performance
or as an alternative to cash flow (as measured by GAAP) as a measure of liquidity. We have included EBITDA, as adjusted, herein because our
management believes this information is useful to investors, as such measure provides additional information with respect to our ability to meet
our future debt service, capital expenditures and working capital requirements. In addition, certain covenants in our indentures and credit facility
are based upon an EBITDA calculation. Our method for calculating EBITDA, as adjusted, may differ from similarly titled measures reported by
other companies. Our management believes certain recapitalization expenses, non-recurring charges, private company expenses, non-cash and
other employee compensation expenses, and merger and integration expenses should be eliminated from the EBITDA calculation to evaluate
our operating performance, and we have done so in our calculation of EBITDA, as adjusted.
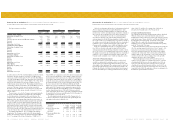
The Following Table Reflects the Effect of These Items for Fiscal Year(1):
(in thousands, except per share and selected store data) 1997 1998 1999 2000 2001
Other Data:
EBITDA(a) $ 65,110 $ 61,793 $ 78,382 $ 159,615 $ 160,344
Supply chain initiatives (see note 2 above) - - - - 9,099
Expenses associated with supply chain initiatives
(see note 4 above) - - - - 1,394
Impairment of assets held for sale (see note 5 above) - - - - 10,700
Recapitalization expenses (see note 6 above) - 14,277 - - -
Merger related restructuring expenses (see note 7 above) - 6,774 - - 3,719
Merger and integration expenses (see note 8 above) - 7,788 41,034 - 1,135
Private company expenses (see note 9 above) 3,056 845 - - -
Non-cash stock option compensation expense
(see note 10 above) - 695 1,082 729 11,735
Non-operating interest expense
on postretirement benefits(b) 195 440 1,401 1,532 1,584
EBITDA, as adjusted(c) $ 68,361 $ 92,612 $ 121,899 $ 161,876 $ 199,710
(a) The 1997 EBITDA amount excludes an unusual medical claim that exceeded our stop-loss insurance coverage. The pre-tax amount of this
claim, net of related increased insurance costs, was $882. We increased our stop-loss coverage effective January 1, 1998 to a level that would
provide insurance coverage for a medical claim of this magnitude.
(b) Represents the interest component of the net periodic postretirement benefit cost associated with our postretirement benefit plan.
(c) EBITDA, as adjusted, for 2000 includes a non-recurring net gain of $3.3 million, which represents a portion of a cash settlement received in
connection with a lawsuit against a supplier. EBITDA, as adjusted, for 2001 includes a non-recurring net gain of $3.2 million, recorded in the
first quarter of 2001, which represents a portion of the cash settlement received in connection with the lawsuit against a supplier, partially offset
by nonrecurring closed store expenses and the $1.6 million write-down of an administrative facility taken in the first quarter of 2001.
(12) Capital expenditures for 2001 exclude $34.1 million for our November 2001 purchase of Discount’s Gallman, Mississippi distribution facility from the
lessor in connection with the Discount acquisition.
(13) Comparable store sales growth is calculated based on the change in net sales starting once a store has been opened for thirteen complete accounting
periods (each period represents four weeks). Relocations are included in comparable store sales from the original date of opening. The Parts America
stores acquired in the Western merger and subsequently converted to Advance Auto Parts stores are included in the comparable store sales calculation
after thirteen complete accounting periods following their physical conversion. Additionally, the stores acquired in the Carport and Discount
acquisitions will be included in the comparable store sales calculation following thirteen complete accounting periods following their system
conversion to the Advance Auto Parts store system. Comparable store sales do not include sales from the Western Auto stores.
(14) Net new stores represent new stores opened and acquired, less
stores closed.
(15) Average net retail sales per store is based on the average of beginning and ending number of stores for the respective period. The 1998 amounts were
calculated giving effect to the Parts America retail net sales and number of stores for the period from November 1, 1998 through January 2, 1999. The
2001 amounts were calculated giving effect to the Discount retail net sales and number of stores for the period from December 2, 2001 through
December 29, 2001.
(16) Average net retail sales per square foot is based on the average of beginning and ending total store square footage for the respective period. The
1998 amounts were calculated giving effect to the Parts America retail net sales and square footage for the period from November 1, 1998 through
January 2, 1999. The 2001 amounts were calculated giving effect to the Discount retail net sales and number of stores for the period from
December 2, 2001 through December 29, 2001.
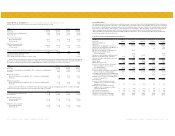
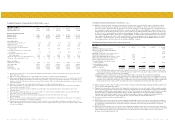
Consolidated Statement of Operations Data for Fiscal Year(1): (continued)
(in thousands, except per share and selected store data) 1997 1998 1999 2000 2001
Other Financial Data:
EBITDA, as adjusted(11) $ 68,361 $ 92,612 $ 121,899 $ 161,876 $ 199,710
Capital expenditures (12) 48,864 65,790 105,017 70,566 63,695
Cash flows provided by (used in):
Operating activities $ 42,478 $ 44,022 $ (20,976) $ 103,951 $ 103,536
Investing activities (48,607) (230,672) (113,824) (64,940) (451,008)
Financing activities 6,759 207,302 121,262 (43,579) 347,580