Advance Auto Parts 2001 Annual Report Download - page 12
Download and view the complete annual report
Please find page 12 of the 2001 Advance Auto Parts annual report below. You can navigate through the pages in the report by either clicking on the pages listed below, or by using the keyword search tool below to find specific information within the annual report.-
 1
1 -
 2
2 -
 3
3 -
 4
4 -
 5
5 -
 6
6 -
 7
7 -
 8
8 -
 9
9 -
 10
10 -
 11
11 -
 12
12 -
 13
13 -
 14
14 -
 15
15 -
 16
16 -
 17
17 -
 18
18 -
 19
19 -
 20
20 -
 21
21 -
 22
22 -
23
-
24
-
25
-
26
-
27
-
28
-
29
 |
 |

18 ADVANCE AUTO PARTS ANNUAL REPORT 2001 ADVANCE AUTO PARTS ANNUAL REPORT 2001 19
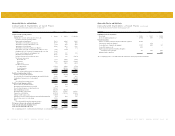
Advance Auto Parts, Inc. and Subsidiaries
Consolidated Statements of Operations
For the Years Ended December 29, 2001, December 30, 2000 and January 1, 2000
(in thousands, except per share data) 2001 2000 1999
Net sales $ 2,517,639 $ 2,288,022 $ 2,206,945
Cost of sales, including purchasing and warehousing costs 1,441,613 1,392,127 1,404,113
Expenses associated with supply chain initiatives 9,099 - -
Gross profit 1,066,927 895,895 802,832
Selling, general and administrative expenses 947,531 801,521 740,481
Expenses associated with supply chain initiatives 1,394 - -
Impairment of assets held for sale 12,300 856 -
Expenses associated with merger-related restructuring 3,719 - -
Expenses associated with merger and integration 1,135 - 41,034
Non-cash stock option compensation expense 11,735 729 1,082
Operating income 89,113 92,789 20,235
Other, net:
Interest expense 61,895 66,640 62,792
Other income, net 1,283 1,012 4,647
Total other expense, net 60,612 65,628 58,145
Income (loss) before provision (benefit) for income taxes, extraordinary
items, and cumulative effect of a change in accounting principle 28,501 27,161 (37,910)
Provision (benefit) for income taxes 11,312 10,535 (12,584)
Income (loss) before extraordinary items and cumulative
effect of a change in accounting principle 17,189 16,626 (25,326)
Extraordinary items, (loss) gain on debt extinguishment, net
of $2,424 and ($1,759) income taxes, respectively (3,682) 2,933 -
Cumulative effect of a change in accounting principle,
net of $1,360 income taxes (2,065) - -
Net income (loss) $ 11,442 $ 19,559 $ (25,326)
Net income (loss) per basic share from:
Income (loss) before extraordinary items and cumulative
effect of a change in accounting principle $ 0.60 $ 0.59 $ (0.90)
Extraordinary items, (loss) gain on debt extinguishment (0.13) 0.10 -
Cumulative effect of a change in accounting principle (0.07) - -
$ 0.40 $ 0.69 $ (0.90)
Net income (loss) per diluted share from:
Income (loss) before extraordinary items and
cumulative effect of a change in accounting principle $ 0.59 $ 0.58 $ (0.90)
Extraordinary items, (loss) gain on debt extinguishment (0.13) 0.10 -
Cumulative effect of a change in accounting principle (0.07) - -
$ 0.39 $ 0.68 $ (0.90)
Average common shares outstanding 28,637 28,296 28,269
Dilutive effect of stock options 521 315 -
Average common shares outstanding - assuming dilution 29,158 28,611 28,269
The accompanying notes to consolidated financial statements are an integral part of these statements.
Advance Auto Parts, Inc. and Subsidiaries
Consolidated Statements of Operations (continued)
For the Years Ended December 29, 2001, December 30, 2000 and January 1, 2000
(in thousands, except per share data) 2001 2000 1999
Pro forma effect of change in accounting principle:
Income (loss) before extraordinary items and cumulative
effect of a change in accounting principle $ 17,189 $ 16,391 $ (25,776)
Per basic share $ 0.60 $ 0.58 $ (0.91)
Per diluted share $ 0.59 $ 0.57 $ (0.91)
Net income (loss) $ 13,507 $ 19,324 $ (25,776)
Per basic share $ 0.47 $ 0.68 $ (0.91)
Per diluted share $ 0.46 $ 0.68 $ (0.91)
The accompanying notes to consolidated financial statements are an integral part of these statements.
Consolidated Statements of Changes in Stockholders’ Equity
For the Years Ended December 29, 2001, December 30, 2000 and January 1, 2000
Additional Stockholder Total
Preferred Stock Common Stock Paid-in Subscription Accumulated Stockholders’
(in thousands) Shares Amount Shares Amount Capital Receivables Deficit Equity
Balance, January 2, 1999 - $ - 28,262 $ 3 $ 371,580 $ (2,526) $(209,966) $ 159,091
Net loss - - - - - - (25,326) (25,326)
Non-cash stock option
compensation expense - - - - 1,082 - - 1,082
Other - - (118) - (908) 518 (503) (893)
Balance, January 1, 2000 - - 28,144 3 371,754 (2,008) (235,795) 133,954
Net income - - - - - - 19,559 19,559
Non-cash stock option
compensation expense - - - - 729 - - 729
Other - - 145 - 2,726 (356) (341) 2,029
Balance, December 30, 2000 - - 28,289 3 375,209 (2,364) (216,577) 156,271
Net income - - - - - - 11,442 11,442
Discount acquisition (Note 3) - - 4,310 - 107,129 - - 107,129
Non-cash stock option
compensation expense - - - - 11,735 - - 11,735
Other - - 93 - 2,465 (312) (159) 1,994
Balance, December 29, 2001 - $ - 32,692 $ 3 $ 496,538 $ (2,676) $ (205,294) $ 288,571
The accompanying notes to consolidated financial statements are an integral part of these statements.