Advance Auto Parts 2001 Annual Report Download - page 20
Download and view the complete annual report
Please find page 20 of the 2001 Advance Auto Parts annual report below. You can navigate through the pages in the report by either clicking on the pages listed below, or by using the keyword search tool below to find specific information within the annual report.-
 1
1 -
2
-
3
-
4
-
5
-
6
-
7
-
8
-
9
-
 10
10 -
 11
11 -
 12
12 -
 13
13 -
 14
14 -
 15
15 -
 16
16 -
 17
17 -
 18
18 -
 19
19 -
 20
20 -
 21
21 -
 22
22 -
 23
23 -
 24
24 -
 25
25 -
 26
26 -
 27
27 -
 28
28 -
 29
29
 |
 |

34 ADVANCE AUTO PARTS ANNUAL REPORT 2001 ADVANCE AUTO PARTS ANNUAL REPORT 2001 35
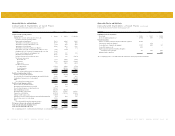
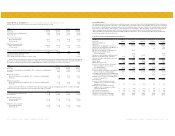
Total option activity was as follows:
2001 2000 1999
Weighted- Weighted- Weighted-
Number of Average Number of Average Number of Average
Shares Exercise Price Shares Exercise Price Shares Exercise Price
Fixed Price Service Options
Outstanding at beginning of year 1,610 $ 18.95 297 $ 14.79 105 $ 10.00
Granted 343 21.00 1,336 19.80 230 16.82
Converted options in connection with Discount acquisition 575 38.89 - - - -
Exercised (62) 35.07 - - - -
Forfeited (28) 17.29 (23) 14.55 (38) 13.90
Outstanding at end of year 2,438 $ 24.52 1,610 $ 18.95 297 $ 14.78
Variable Price Service Options
Outstanding at beginning of year 297 $ 15.00 329 $ 15.00 397 $ 15.00
Granted - - - - - -
Exercised - - - - - -
Forfeited (2) 15.00 (32) 15.00 (68) 15.00
Outstanding at end of year 295 $18.00 297 $15.00 329 $15.00
Performance Options
Outstanding at beginning of year 297 $ 10.00 329 $ 10.00 397 $ 10.00
Granted - - - - - -
Exercised - - - - - -
Forfeited (2) 10.00 (32) 10.00 (68) 10.00
Outstanding at end of year 295 $ 10.00 297 $ 10.00 329 $ 10.00
Other Options
Outstanding at beginning of year 500 $ 14.00 500 $ 12.00 500 $ 10.00
Granted - - - - - -
Exercised - - - - - -
Forfeited - - - - - -
Outstanding at end of year 500 $ 16.00 500 $ 14.00 500 $ 12.00
Advance Auto Parts, Inc. and Subsidiaries Notes to Consolidated Financial Statements (continued)
December 29, 2001, December 30, 2000 and January 1, 2000 (in thousands, except per share data and per store data)
As of December 29, 2001, 642 of the Fixed Options and all of the Variable,
Performance and other options were exercisable at a weighted average
exercise price of $16.07. At December 30, 2000, 118 of the Fixed Options,
148 of the Variable Options and all of the other options were exercisable at
a weighted average exercise price of $14.07. Only the 500 of other options
and 29 of the fixed options were exercisable at January 1, 2000 at a
weighted-average exercise price $11.89. The remaining weighted-average
contractual life of the Fixed, Performance and Variable Options are four to
seven years. The range of exercise prices for options exercisable at
December 29, 2001 and December 30, 2000 were $10.00 to $16.82. The
range of exercise prices for options exercisable at January 1, 2000 were
$10.00 to $12.00.
The exercise price for each of the Company’s option grants during the
fiscal year ended 1999 equaled the fair market value of the underlying
stock on the grant date as determined by the board of directors. The
weighted-average fair value for the grants during fiscal 1999 was $2.05.
During fiscal 2000, the Company granted options at an exercise price of
$16.82, which equaled the then determined fair market value, and $20.00
and $25.00, which exceeded the then determined fair market value. The
weighted-average fair value of options granted at $16.82 was $1.44. The
options granted at $20.00 and $25.00 had no fair value on the grant date.
During fiscal 2001, the Company granted 343 options at an exercise price
of $21.00, the fair value at the date of the grant as determined by the board
of directors. The fair value of the options granted at $21.00 was $13.53.
As permitted under SFAS No. 123, “Accounting for Stock-Based
Compensation,” the Company accounts for its stock options using the
intrinsic value method prescribed in Accounting Principles Board Opinion
No. 25, “Accounting for Stock Issued to Employees” (“APB No. 25”).
Under APB No. 25, compensation cost for stock options is measured as the
excess, if any, of the market price of the Company’s common stock at the
measurement date over the exercise price. Accordingly, the Company has
not recognized compensation expense on the issuance of its Fixed Options
because the exercise price equaled the fair market value of the underlying
stock on the grant date. The excess of the fair market value per share over
the exercise price per share for the Performance Options and Variable
Options was recorded as outstanding stock options included in additional
paid-in capital. The Company recorded compensation expense related to
the Performance Options and Variable Options of $11,735 (including the
one-time charge discussed above), $729 and $1,082 in non-cash stock
option compensation expense in the accompanying consolidated statements
of operations for the fiscal years ended December 29, 2001, December 30,
2000 and January 1, 2000, respectively.
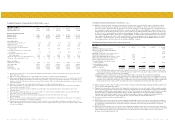
The following information is presented as if the Company elected to
account for compensation cost related to the stock options using the fair
value method as prescribed by SFAS No. 123:
2001 2000 1999
Net income (loss):
As reported $ 11,442 $ 19,559 $ (25,326)
Pro-forma $7,496 19,674 (24,842)
Net income per basic share:
As reported $ 0.40 $ 0.69 $ (0.90)
Pro-forma $ 0.26 $ 0.70 $ (0.88)
Net income per diluted share:
As reported $ 0.39 $ 0.68 $ (0.90)
Pro-forma $ 0.26 $ 0.69 $ (0.88)
For the above information, the fair value of each option granted in fiscal
2001 was estimated on the grant date using the Black-Scholes option-
pricing model with the following assumptions: (i) weighted average risk-
free interest rate of 2.89%; (ii) weighted-average expected life of options of
three years; (iii) expected dividend yield of zero and (iv) volatility of 60%.
For the above information, the fair value of each option granted in
fiscal 2000 was estimated on the grant date using the Black-Scholes
option-pricing model with the following assumptions: (i) risk-free interest
rate of 4.47% and 4.57%; (ii) weighted-average expected life of options of
two and three years and (iii) expected dividend yield of zero. As permitted
by SFAS No. 123 for companies with non-public equity securities, the
Company used the assumption of zero volatility in valuing these options.
For the above information, the fair value of each option granted in
fiscal 1999 was estimated on the grant date using the Black-Scholes
option-pricing model with the following assumptions: (i) risk-free interest
rate of 5.19% and 5.27%; (ii) weighted-average expected life of options of
two and three years and (iii) expected dividend yield of zero. As permitted
by SFAS No. 123 for companies with non-public equity securities, the
Company used the assumption of zero volatility in valuing these options.
23. Fair Value of Financial Instruments:
The carrying amount of cash and cash equivalents, receivables, bank
overdrafts, accounts payable, borrowings secured by receivables and
current portion of long-term debt approximates fair value because of the
short maturity of those instruments. The carrying amount for variable rate
long-term debt approximates fair value for similar issues available to the
Company. The fair value of all fixed rate long-term debt was determined
based on current market prices, which approximated $457,804 (carrying
value of $450,737) and $163,473 (carrying value of $253,665) at
December 29, 2001 and December 30, 2000, respectively.
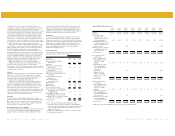
24. Segment and Related Information:
The Company has the following operating segments: Advance, Retail and
Wholesale. Advance has no operations but holds certain assets and
liabilities. Retail consists of the retail operations of the Company, operating
under the trade name “Advance Auto Parts” and “Discount Auto Parts” in
the United States and “Western Auto” in Puerto Rico and the Virgin
Islands. Wholesale consists of the wholesale operations, including
distribution services to independent dealers and franchisees all operating
under the “Western Auto” trade name.
The financial information for fiscal 2000 and 1999 has been restated to
reflect the operating segments described above. Prior to January 1, 2000,
management received and used financial information at the Advance
Stores and consolidated Western levels. The Advance Stores segment
consisted of the “Advance Auto Parts” retail locations and the Western
segment consisted of the “Western Auto” retail locations and wholesale
operations described above. The accounting policies of the reportable
segments are the same as those of the Company.
The financial information for fiscal 2000 and 1999 has not been
restated to reflect the change in accounting policy related to cooperative
advertising funds. Had the new policy been applied in fiscal 2000 and
1999, gross profit and income before provision for income taxes and
extraordinary item in the Retail segment would have been $829,475 and
$39,393, respectively, in fiscal 2000 and $739,563 and a loss of $21,722,
respectively, in fiscal 1999. The application of the new accounting policy to
the Wholesale segment would not be material.
Advance Auto Parts, Inc. and Subsidiaries Notes to Consolidated Financial Statements (continued)
December 29, 2001, December 30, 2000 and January 1, 2000 (in thousands, except per share data and per store data)