Advance Auto Parts 2001 Annual Report Download - page 22
Download and view the complete annual report
Please find page 22 of the 2001 Advance Auto Parts annual report below. You can navigate through the pages in the report by either clicking on the pages listed below, or by using the keyword search tool below to find specific information within the annual report.-
 1
1 -
2
-
3
-
4
-
5
-
6
-
7
-
8
-
9
-
10
-
11
-
 12
12 -
 13
13 -
 14
14 -
 15
15 -
 16
16 -
 17
17 -
 18
18 -
 19
19 -
 20
20 -
 21
21 -
 22
22 -
 23
23 -
 24
24 -
 25
25 -
 26
26 -
 27
27 -
 28
28 -
 29
29
 |
 |

38 ADVANCE AUTO PARTS ANNUAL REPORT 2001 ADVANCE AUTO PARTS ANNUAL REPORT 2001 39
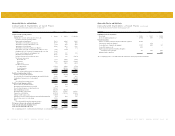
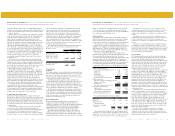
2000 First Second Third Fourth
Net sales $ 677,582 $ 557,650 $ 552,138 $ 500,652
Gross profit 258,975 216,533 223,903 196,484
(Loss) income before extraordinary item (956) 10,381 9,507 (2,306)
Net (loss) income (956) 10,381 12,440 (2,306)
Basic (loss) income per share:
Before extraordinary item $(0.03) $0.37 $0.34 $(0.08)
Net (loss) income (0.03) 0.37 0.44 (0.08)
Diluted (loss) income per share:
Before extraordinary item $ (0.03) $ 0.36 $ 0.33 $ (0.08)
Net (loss) income (0.03) 0.36 0.44 (0.08)
The above fiscal 2000 quarterly information includes non-recurring gains and losses by quarter as follows:
First Second Third Fourth
Non-cash stock option compensation expense $ 352 $ 249 $ (66) $ 194
Impairment on assets held for sale - - - 856
Non-recurring gain from the settlement of a vendor contract - - - (3,300)
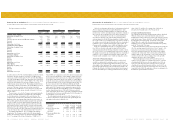
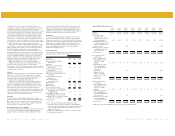
Results of operations for the first three quarters of fiscal 2001 differ from the amounts previously reported in the Company’s 2001 Form 10-Q Quarterly
Reports due to a change in the Company’s method of accounting for cooperative advertising funds received from vendors (Note 2). Results of operations as
previously reported in the Company’s 2001 Form 10-Q Quarterly Reports for the first three quarters of fiscal 2001 were as follows:
2001 First Second Third
Net sales $ 729,359 $ 607,478 $ 598,793
Gross profit 295,939 244,341 244,063
Income before extraordinary item and cumulative effect of a change in accounting principle 4,951 16,453 15,505
Net income 4,951 16,453 15,505
Basic income per share:
Before extraordinary item and cumulative effect of a change in accounting principle $ 0.18 $ 0.58 $ 0.55
Net income 0.18 0.58 0.55
Diluted income per share:
Before extraordinary item and cumulative effect of a change in accounting principle $ 0.17 $ 0.58 $ 0.54
Net income 0.17 0.58 0.54
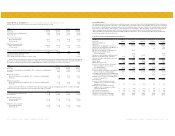
Results of operations for the fiscal year ended 2000 do not reflect the Company’s change in accounting principle related to cooperative advertising
funds. Fiscal 2000 results of operations on a pro forma basis for this change are as follows:
2000 First Second Third Fourth
(Loss) income before extraordinary item $ (3,714) $ 10,766 $ 10,789 $ (1,450)
Net (loss) income (3,714) 10,766 13,722 (1,450)
Basic (loss) income per share:
Before extraordinary item $ (0.13) $ 0.38 $ 0.38 $ (0.05)
Net (loss) income (0.13) 0.38 0.48 (0.05)
Diluted (loss) income per share:
Before extraordinary item $ (0.13) $ 0.38 $ 0.38 $ (0.05)
Net (loss) income (0.13) 0.38 0.48 (0.05)
Advance Auto Parts, Inc. and Subsidiaries Notes to Consolidated Financial Statements (continued)
December 29, 2001, December 30, 2000 and January 1, 2000 (in thousands, except per share data and per store data)
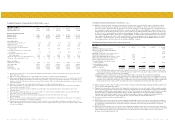
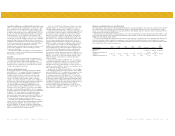
Selected Financial Data
The following table sets forth our selected historical consolidated statement of operations, balance sheet and other operating data. The selected historical
consolidated financial and other data at December 30, 2000 and December 29, 2001 and for the three years ended December 29, 2001 have been derived
from our audited consolidated financial statements and the related notes included elsewhere in this report. The historical consolidated financial and other
data at January 3, 1998, January 2, 1999 and January 1, 2000 and for the years ended January 3, 1998 and January 2, 1999 have been derived from our
audited consolidated financial statements and the related notes that have not been included in this report. You should read this data along with
“Management’s Discussion and Analysis of Financial Condition and Results of Operations,” and the consolidated financial statements and the related
notes of Advance included elsewhere in this report.
Consolidated Statement of Operations Data for Fiscal Year(1):
(in thousands, except per share and selected store data) 1997 1998 1999 2000 2001
Net sales $ 848,108 $ 1,220,759 $ 2,206,945 $ 2,288,022 $ 2,517,639
Cost of sales 524,586 766,198 1,404,113 1,392,127 1,441,613
Supply chain initiatives (2) ----9,099
Gross profit 323,522 454,561 802,832 895,895 1,066,927
Selling, general and administrative expenses (3) 278,039 392,353 740,481 801,521 947,531
Expenses associated with supply chain initiatives (4) ----1,394
Impairment of assets held for sale (5) - - - 856 12,300
Expenses associated with the recapitalization (6) - 14,277 - - -
Expenses associated with the merger
related restructuring (7) - 6,774 - - 3,719
Expenses associated with merger and integration (8) - 7,788 41,034 - 1,135
Expenses associated with private company (9) 3,056 845 - - -
Non-cash stock option compensation expense (10) - 695 1,082 729 11,735
Operating income 42,427 31,829 20,235 92,789 89,113
Interest expense 6,086 35,038 62,792 66,640 61,895
Other income (expense), net (321) 943 4,647 1,012 1,283
Income (loss) before income taxes, extraordinary
items and cumulative effect of a change
in accounting principle 36,020 (2,266) (37,910) 27,161 28,501
Income tax expense (benefit) 14,733 (84) (12,584) 10,535 11,312
Income (loss) before extraordinary item and cumulative
effect of a change in accounting principle 21,287 (2,182) (25,326) 16,626 17,189
Extraordinary item, gain (loss) on debt extinguishment,
net of ($1,759) and $2,424 income taxes, respectively - - - 2,933 (3,682)
Cumulative effect of a change in accounting principle,
net of $1,360 income taxes ----(2,065)
Net income (loss) $ 21,287 $ (2,182) $ (25,326) $ 19,559 $ 11,442
Income (loss) before extraordinary item and
cumulative effect of a change in accounting
principle per basic share $ 0.87 $ (0.12) $ (0.90) $ 0.59 $ 0.60
Income (loss) before extraordinary item and
cumulative effect of a change in accounting
principle per diluted share $ 0.87 $ (0.12) $ (0.90) $ 0.58 $ 0.59
Net income (loss) per basic share $ 0.87 $ (0.12) $ (0.90) $ 0.69 $ 0.40
Net income (loss) per diluted share $ 0.87 $ (0.12) $ (0.90) $ 0.68 $ 0.39
Weighted average basic shares outstanding 24,288 18,606 28,269 28,296 28,637
Weighted average diluted shares outstanding 24,288 18,606 28,269 28,611 29,158