Advance Auto Parts 2001 Annual Report Download - page 21
Download and view the complete annual report
Please find page 21 of the 2001 Advance Auto Parts annual report below. You can navigate through the pages in the report by either clicking on the pages listed below, or by using the keyword search tool below to find specific information within the annual report.-
 1
1 -
2
-
3
-
4
-
5
-
6
-
7
-
8
-
9
-
10
-
 11
11 -
 12
12 -
 13
13 -
 14
14 -
 15
15 -
 16
16 -
 17
17 -
 18
18 -
 19
19 -
 20
20 -
 21
21 -
 22
22 -
 23
23 -
 24
24 -
 25
25 -
 26
26 -
 27
27 -
 28
28 -
 29
29
 |
 |

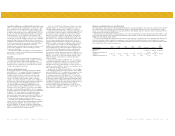
36 ADVANCE AUTO PARTS ANNUAL REPORT 2001 ADVANCE AUTO PARTS ANNUAL REPORT 2001 37
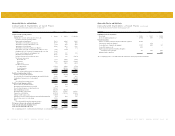
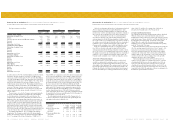
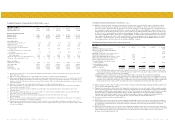
2001 (a) Advance Retail Wholesale (b) Eliminations Totals
Net sales (c) $ - $ 2,419,746 $ 97,893 $ - $ 2,517,639
Gross profit - 1,052,881 14,046 - 1,066,927
Operating income (loss) - 97,475 (8,362) - 89,113
Net interest expense (11,245) (47,686) (1,882) - (60,813)
(Loss) income before (benefit) provision for
income taxes, extraordinary item and
change in accounting method (d) (11,245) 50,323 (10,577) - 28,501
Extraordinary item, loss on debt extinguishment,
net of $ 2,424 income taxes - (3,682) - - (3,682)
Change in accounting method,
net of $1,360 income taxes - (2,065) - - (2,065)
Segment assets (d) 14,247 1,911,026 26,877 (1,535) 1,950,615
Depreciation and amortization - 69,927 1,304 - 71,231
Capital expenditures - 63,327 368 - 63,695
2000
Net sales (c) $ - $ 2,167,308 $ 120,714 $ - $ 2,288,022
Gross profit - 881,012 14,883 - 895,895
Operating income - 91,590 1,199 - 92,789
Net interest expense (9,871) (51,684) (4,141) - (65,696)
(Loss) income before (benefit) provision for
income taxes and extraordinary item (d) (9,871) 39,626 (2,594) - 27,161
Extraordinary item, gain on debt extinguishment,
net of ($1,759) income taxes - 2,933 - - 2,933
Segment assets (d) 10,556 1,307,839 49,421 (11,456) 1,356,360
Depreciation and amortization - 65,625 1,201 - 66,826
Capital expenditures - 70,493 73 - 70,566
1999 (e)
Net sales (c) $ - $ 2,017,425 $ 189,520 $ - $ 2,206,945
Gross profit - 791,985 10,847 - 802,832
Operating income (loss) - 29,517 (9,282) - 20,235
Net interest expense (8,717) (50,789) (2,654) - (62,160)
Loss before benefit for income taxes (d) (8,717) (21,272) (7,921) - (37,910)
Segment assets (d) 13,036 1,266,199 78,753 (9,359) 1,348,629
Depreciation and amortization - 53,296 4,851 - 58,147
Capital expenditures - 97,000 8,017 - 105,017
(a) Amounts include non-recurring expenses separately disclosed in the accompanying statement of operations.
(b) During fiscal 1999, certain assets, liabilities and the corresponding activity related to the Parts America store operations and a distribution center were
transferred to the Retail segment through a dividend to Retail. Additionally, throughout fiscal 2000, the Company transferred certain assets to the Retail
segment related to the Western Auto retail operations in Puerto Rico and the Virgin Islands.
(c) For fiscal years 2001, 2000, and 1999, total net sales include approximately $403,000, $356,000 and $245,000, respectively, related to revenues derived
from commercial sales.
(d) Excludes investment in and equity in net earnings or losses of subsidiaries.
(e) Fiscal 1999 results of operations do not reflect the allocation of certain shared expenses to the Wholesale segment. During fiscal 2000, Management
adopted a method for allocating shared expenses.
Advance Auto Parts, Inc. and Subsidiaries Notes to Consolidated Financial Statements (continued)
December 29, 2001, December 30, 2000 and January 1, 2000 (in thousands, except per share data and per store data)
Advance Auto Parts, Inc. and Subsidiaries Notes to Consolidated Financial Statements (continued)
December 29, 2001, December 30, 2000 and January 1, 2000 (in thousands, except per share data and per store data)
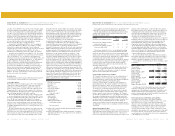
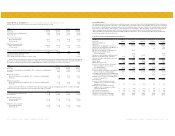
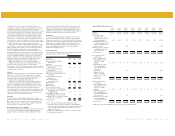
25. Quarterly Financial Data (unaudited):
The following table summarizes quarterly financial data for fiscal years 2001 and 2000:
2001 First Second Third Fourth
Net sales $ 729,359 $ 607,478 $ 598,793 $ 582,009
Gross profit 311,450 257,228 256,734 241,515
Income (loss) before extraordinary item and cumulative effect
of a change in accounting principle 3,873 14,124 15,232 (16,040)
Net income (loss) 3,873 14,124 15,232 (21,787)
Basic income (loss) per share:
Before extraordinary item and cumulative effect of a change
in accounting principle $ 0.14 $ 0.50 $ 0.54 $ (0.54)
Net income (loss) 0.14 0.50 0.54 (0.73)
Diluted income (loss) per share:
Before extraordinary item and cumulative effect of a change
in accounting principle $ 0.14 $ 0.49 $ 0.53 $ (0.54)
Net income (loss) 0.14 0.49 0.53 (0.73)
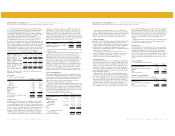
The above fiscal 2001 quarterly information includes non-recurring gains and losses by quarter as follows:
First Second Third Fourth
Expenses associated with supply chain initiatives - gross profit $ - $ - $ - $ 9,099
Expenses associated with supply chain initiatives - selling, general and
administrative expense - - - 1,394
Impairment of assets held for sales 1,600 - - 10,700
Expenses associated with merger-related restructuring - - - 3,719
Expenses associated with merger and integration - - - 1,135
Non-cash stock option compensation expense 1,109 233 1,520 8,873
Non-recurring gain from the settlement of a vendor contract (8,300) - - -