Xcel Energy 2012 Annual Report Download - page 69
Download and view the complete annual report
Please find page 69 of the 2012 Xcel Energy annual report below. You can navigate through the pages in the report by either clicking on the pages listed below, or by using the keyword search tool below to find specific information within the annual report.-
 1
1 -
2
-
3
-
4
-
5
-
6
-
7
-
8
-
9
-
10
-
11
-
12
-
13
-
14
-
15
-
16
-
17
-
18
-
19
-
20
-
21
-
22
-
23
-
24
-
25
-
26
-
27
-
28
-
29
-
30
-
31
-
32
-
33
-
34
-
35
-
36
-
37
-
38
-
39
-
40
-
41
-
42
-
43
-
44
-
45
-
46
-
47
-
48
-
49
-
50
-
51
-
52
-
53
-
54
-
55
-
56
-
57
-
58
-
 59
59 -
 60
60 -
 61
61 -
 62
62 -
 63
63 -
 64
64 -
 65
65 -
 66
66 -
 67
67 -
 68
68 -
 69
69 -
 70
70 -
 71
71 -
 72
72 -
 73
73 -
 74
74 -
 75
75 -
 76
76 -
 77
77 -
 78
78 -
 79
79 -
80
-
81
-
82
-
83
-
84
-
85
-
86
-
87
-
88
-
89
-
90
-
91
-
92
-
93
-
94
-
95
-
96
-
97
-
98
-
99
-
100
-
101
-
102
-
103
-
104
-
105
-
106
-
107
-
108
-
109
-
110
-
111
-
112
-
113
-
114
-
115
-
116
-
117
-
118
-
119
-
120
-
121
-
122
-
123
-
124
-
125
-
126
-
127
-
128
-
129
-
130
-
131
-
132
-
133
-
134
-
135
-
136
-
137
-
138
-
139
-
140
-
141
-
142
-
143
-
144
-
145
-
146
-
147
-
148
-
149
-
150
-
151
-
152
-
153
-
154
-
155
-
156
-
157
-
158
-
159
-
160
-
161
-
162
-
163
-
164
-
165
-
166
-
167
-
168
-
169
-
170
-
171
-
172
 |
 |

59
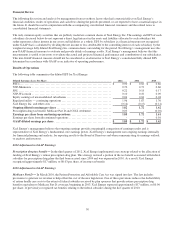
AFUDC — AFUDC increased $18.8 million for 2012, compared with 2011. The increase is primarily due to the expansion of
PSCo’s transmission facilities, additional construction related to the Colorado CACJA and life extension work at the Prairie
Island nuclear generating plant.
AFUDC decreased $5.4 million, or 6.4 percent for 2011, compared with 2010. The decrease is primarily due to lower AFUDC
rates and lower average CWIP. The lower average CWIP is attributed to Comanche Unit 3 and the Nobles wind project going into
service in 2010, offset by Monticello EPU and work at the Jones plant, as well as SPS transmission projects in 2011.
Interest Charges — Interest charges increased $10.5 million, or 1.8 percent for 2012, compared with 2011, and $13.8 million, or
2.4 percent for 2011, compared with 2010. The increase is due to higher long-term debt levels to fund investment in utility
operations, partially offset by lower interest rates.
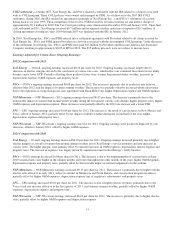
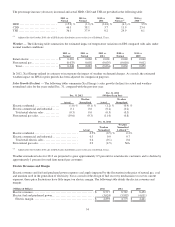
Income Taxes — Income tax expense for continuing operations decreased $18.1 million for 2012, compared with 2011. The
decrease in income tax expense was primarily due to a tax benefit associated with a carryback and a tax benefit related to the
restoration of a portion of the tax benefit written off in 2010 associated with federal subsidies for prescription drug plans. As a
result, Xcel Energy recognized discrete tax benefits of approximately $14.9 million for the carryback and $17 million for the tax
benefit associated with the federal subsidies. These were partially offset by higher pretax income in 2012. The ETR for continuing
operations was 33.2 percent for 2012, compared with 35.8 percent for 2011. The lower ETR for 2012 was primarily due to the
adjustments referenced above. The ETR would have been 35.6 percent for 2012 without these tax benefits.
Income tax expense for continuing operations increased $31.7 million for 2011, compared with 2010. The increase is primarily
due to higher pretax income, a net change in tax valuation allowances of $8.9 million, and the non-taxability of the Provident
settlement in 2010. These were partially offset by the 2010 write-off of the tax benefit for Medicare Part D subsidies, an
adjustment related to COLI and an increase in 2011 wind PTCs. The ETR for continuing operations was 35.8 percent for 2011,
compared with 36.7 percent for 2010. The higher ETR for 2010 was primarily due to the Medicare Part D, COLI, and the
valuation allowance adjustments referenced above. Without these adjustments, the ETR for continuing operations for 2010 would
have been 35.1 percent. See Note 10 in the notes to consolidated financial statements for further discussion on COLI.
Premium on Redemption of Preferred Stock — Xcel Energy Inc. redeemed all series of its preferred stock on Oct. 31, 2011, at
an aggregate purchase price of $108 million, plus accrued dividends. As such, the redemption premium of $3.3 million and
accrued dividends are reflected as reductions to earnings available to common shareholders for 2011.
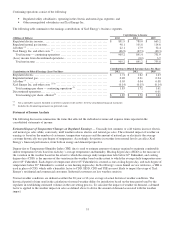
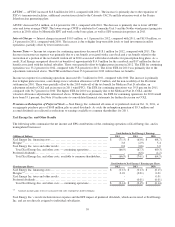
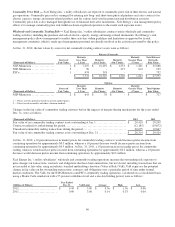
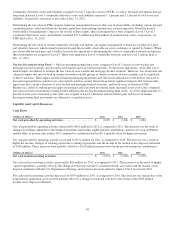
Xcel Energy Inc. and Other Results
The following tables summarize the net income and EPS contributions of the continuing operations of Xcel Energy Inc. and its
nonregulated businesses:
Contribution to Xcel Energy's Earnings
(Millions of Dollars)
2012
2011
2010
Xcel Energy Inc. financing costs .............................................. $
(71.5
)
$
(63.8)
$
(68.7)
Eloigne (a) ...................................................................
3.8
(2.9)
5.4
Xcel Energy Inc. taxes and other results .......................................
0.8
(0.6)
3.0
Total Xcel Energy Inc. and other costs — continuing operations ...............
(66.9
)
(67.3)
(60.3)
Preferred dividends ..........................................................
-
(6.8)
(4.2)
Total Xcel Energy Inc. and other costs, available to common shareholders......
$
(66.9
)
$
(74.1)
$
(64.5)
Contribution to Xcel Energy's Earnings per Share
(Earnings per Share)
2012
2011
2010
Xcel Energy Inc. financing costs .............................................. $
(0.15
)
$
(0.13)
$
(0.15)
Eloigne (a) ...................................................................
0.01
(0.01)
0.01
Xcel Energy Inc. taxes and other results .......................................
-
-
0.01
Preferred dividends ..........................................................
-
(0.01)
(0.01)
Total Xcel Energy Inc. and other costs — continuing operations ............... $
(0.14
)
$
(0.15)
$
(0.14)
(a) Amounts include gains or losses associated with sales of properties held by Eloigne.
Xcel Energy Inc.’s results include interest expense and the EPS impact of preferred dividends, which are incurred at Xcel Energy
Inc. and are not directly assigned to individual subsidiaries.