Xcel Energy 2012 Annual Report Download - page 65
Download and view the complete annual report
Please find page 65 of the 2012 Xcel Energy annual report below. You can navigate through the pages in the report by either clicking on the pages listed below, or by using the keyword search tool below to find specific information within the annual report.-
 1
1 -
2
-
3
-
4
-
5
-
6
-
7
-
8
-
9
-
10
-
11
-
12
-
13
-
14
-
15
-
16
-
17
-
18
-
19
-
20
-
21
-
22
-
23
-
24
-
25
-
26
-
27
-
28
-
29
-
30
-
31
-
32
-
33
-
34
-
35
-
36
-
37
-
38
-
39
-
40
-
41
-
42
-
43
-
44
-
45
-
46
-
47
-
48
-
49
-
50
-
51
-
52
-
53
-
54
-
 55
55 -
 56
56 -
 57
57 -
 58
58 -
 59
59 -
 60
60 -
 61
61 -
 62
62 -
 63
63 -
 64
64 -
 65
65 -
 66
66 -
 67
67 -
 68
68 -
 69
69 -
 70
70 -
 71
71 -
 72
72 -
 73
73 -
 74
74 -
 75
75 -
76
-
77
-
78
-
79
-
80
-
81
-
82
-
83
-
84
-
85
-
86
-
87
-
88
-
89
-
90
-
91
-
92
-
93
-
94
-
95
-
96
-
97
-
98
-
99
-
100
-
101
-
102
-
103
-
104
-
105
-
106
-
107
-
108
-
109
-
110
-
111
-
112
-
113
-
114
-
115
-
116
-
117
-
118
-
119
-
120
-
121
-
122
-
123
-
124
-
125
-
126
-
127
-
128
-
129
-
130
-
131
-
132
-
133
-
134
-
135
-
136
-
137
-
138
-
139
-
140
-
141
-
142
-
143
-
144
-
145
-
146
-
147
-
148
-
149
-
150
-
151
-
152
-
153
-
154
-
155
-
156
-
157
-
158
-
159
-
160
-
161
-
162
-
163
-
164
-
165
-
166
-
167
-
168
-
169
-
170
-
171
-
172
 |
 |

55
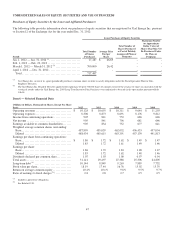
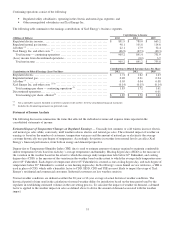
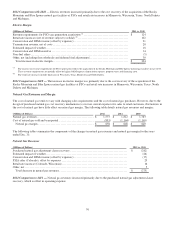
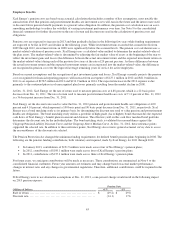
The following tables summarize the components of the changes in electric revenues and electric margin for the years ended Dec. 31:
Electric Revenues
(Millions of Dollars)
2012 vs. 2011
Fuel and purchased power cost recovery ........................................................ $
(394
)
Firm wholesale (a).............................................................................
(58
)
Retail sales decrease, excluding weather impact .................................................
(6
)
Conservation and DSM revenue (offset by expenses) ............................................
(5
)
Retail rate increases (Colorado, Texas, New Mexico, Wisconsin, South Dakota, North Dakota,
Michigan and Minnesota) ...................................................................
125
Transmission revenue .........................................................................
44
Demand revenue .............................................................................
13
Conservation and DSM incentive ..............................................................
12
Estimated impact of weather...................................................................
1
Other, net ....................................................................................
18
Total decrease in electric revenue ............................................................
$
(250
)
(a) Decrease is primarily due to the expiration of a long-term wholesale power sales agreement with Black Hills Corp., effective Jan. 1, 2012.
2012 Comparison with 2011 — Electric revenues decreased primarily due to lower fuel and purchased power cost recovery, which is
offset in operating expense. This decrease was partially offset by the various rate increases across all of the utility subsidiaries.
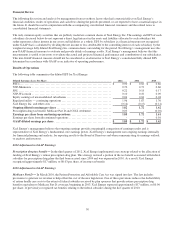
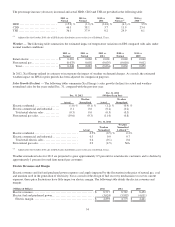
Electric Margin
(Millions of Dollars)
2012 vs. 2011
Retail rate increases (Colorado, Texas, New Mexico, Wisconsin, South Dakota, North Dakota,
Michigan and Minnesota) ................................................................... $
125
Demand revenue .............................................................................
13
Transmission revenue, net of costs .............................................................
13
Conservation and DSM incentive ..............................................................
12
Estimated impact of weather...................................................................
1
Firm wholesale (a).............................................................................
(48
)
Retail sales decrease, excluding weather impact .................................................
(6
)
Conservation and DSM revenue (offset by expenses) ............................................
(5
)
Other, net ....................................................................................
13
Total increase in electric margin .............................................................
$
118
(a) Decrease is primarily due to the expiration of a long-term wholesale power sales agreement with Black Hills Corp., effective Jan. 1, 2012.
2012 Comparison to 2011 — The increase in electric margin was primarily due to the various rate increases across all of the
utility subsidiaries.
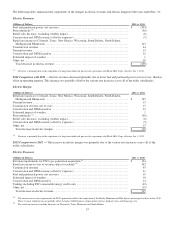
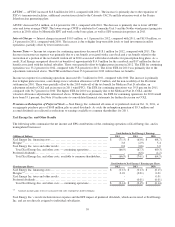
Electric Revenues
(Millions of Dollars)
2011 vs. 2010
Revenue requirements for PSCo gas generation acquisition (a) .................................... $
124
Retail rate increases (net of revenue subject to refund) (b) .........................................
102
Transmission revenue .........................................................................
45
Conservation and DSM revenue (offset by expenses) ............................................
31
Fuel and purchased power cost recovery ........................................................
19
Estimated impact of weather...................................................................
18
Conservation and DSM incentive ..............................................................
14
Trading, including PSCo renewable energy credit sales ..........................................
(19
)
Other, net ....................................................................................
(19
)
Total increase in electric revenue ............................................................
$
315
(a) The increase in revenue requirements for PSCo generation reflects the acquisition of the Rocky Mountain and Blue Spruce natural gas facilities in late 2010.
These revenue requirements are partially offset by higher O&M expense, depreciation expense, property taxes and financing costs.
(b) The retail rate increases include final rates in Wisconsin, Texas, Minnesota and North Dakota.