Xcel Energy 2012 Annual Report Download - page 19
Download and view the complete annual report
Please find page 19 of the 2012 Xcel Energy annual report below. You can navigate through the pages in the report by either clicking on the pages listed below, or by using the keyword search tool below to find specific information within the annual report.-
 1
1 -
2
-
3
-
4
-
5
-
6
-
7
-
8
-
 9
9 -
 10
10 -
 11
11 -
 12
12 -
 13
13 -
 14
14 -
 15
15 -
 16
16 -
 17
17 -
 18
18 -
 19
19 -
 20
20 -
 21
21 -
 22
22 -
 23
23 -
 24
24 -
 25
25 -
 26
26 -
 27
27 -
 28
28 -
 29
29 -
30
-
31
-
32
-
33
-
34
-
35
-
36
-
37
-
38
-
39
-
40
-
41
-
42
-
43
-
44
-
45
-
46
-
47
-
48
-
49
-
50
-
51
-
52
-
53
-
54
-
55
-
56
-
57
-
58
-
59
-
60
-
61
-
62
-
63
-
64
-
65
-
66
-
67
-
68
-
69
-
70
-
71
-
72
-
73
-
74
-
75
-
76
-
77
-
78
-
79
-
80
-
81
-
82
-
83
-
84
-
85
-
86
-
87
-
88
-
89
-
90
-
91
-
92
-
93
-
94
-
95
-
96
-
97
-
98
-
99
-
100
-
101
-
102
-
103
-
104
-
105
-
106
-
107
-
108
-
109
-
110
-
111
-
112
-
113
-
114
-
115
-
116
-
117
-
118
-
119
-
120
-
121
-
122
-
123
-
124
-
125
-
126
-
127
-
128
-
129
-
130
-
131
-
132
-
133
-
134
-
135
-
136
-
137
-
138
-
139
-
140
-
141
-
142
-
143
-
144
-
145
-
146
-
147
-
148
-
149
-
150
-
151
-
152
-
153
-
154
-
155
-
156
-
157
-
158
-
159
-
160
-
161
-
162
-
163
-
164
-
165
-
166
-
167
-
168
-
169
-
170
-
171
-
172
 |
 |

9
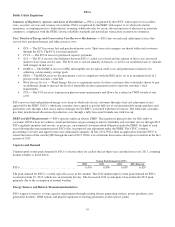
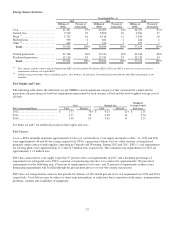
Capacity and Demand
Uninterrupted system peak demand for the NSP System’s electric utility for each of the last three years and the forecast for 2013,
assuming normal weather, is listed below.
System Peak Demand (in MW)
2010
2011
2012
2013 Forecast
NSP System.......................................
9,131
9,792
9,475
9,215
The peak demand for the NSP System typically occurs in the summer. The 2012 uninterrupted system peak demand for the NSP
System occurred on July 2, 2012. The 2011 peak demand occurred on a day with extremely high temperatures and humidity,
which resulted in the highest uninterrupted system peak demand since July 31, 2006. The 2012 peak demand occurred
uninterrupted on a day with weather much closer to normal peak day conditions. The forecast for 2013 assumes normal peak day
weather and includes the impact of the termination of several firm wholesale contracts primarily at NSP-Wisconsin. The 2013
forecast also reflects the impact of two large commercial and industrial customers that have ceased operations. These customers
represented 0.05 percent of 2012 sales.
Energy Sources and Related Transmission Initiatives
NSP-Minnesota expects to use existing power plants, power purchases, CIP options, new generation facilities and expansion of
existing power plants to meet its system capacity requirements.
Purchased Power — NSP-Minnesota has contracts to purchase power from other utilities and independent power producers.
Long-term purchased power contracts typically require a periodic payment to secure the capacity and a charge for the associated
energy actually purchased. NSP-Minnesota also makes short-term purchases to meet system load and energy requirements, to
replace generation from company-owned units under maintenance or during outages, to meet operating reserve obligations, or to
obtain energy at a lower cost.
Purchased Transmission Services — In addition to using their integrated transmission system, NSP-Minnesota and NSP-
Wisconsin have contracts with MISO and regional transmission service providers to deliver power and energy to the NSP System.
NSP System Resource Plans — In November 2012, the MPUC issued an order on NSP-Minnesota’s resource plan and required
additional filings to determine the next resources needed for the NSP System generating capacity. In December 2012, NSP-
Minnesota filed its information indicating an estimated need of 150 MW in 2017 and increasing to 440 MW by 2019, with the
size and timing to be determined by the MPUC. A competitive acquisition process is anticipated to commence in March 2013 and
result in the selection of a developer or developers by the MPUC in the fourth quarter of 2013. See additional discussion within
the Prairie Island Nuclear EPU section below.
CapX2020 — In 2009, the MPUC granted CONs to construct one 230 KV electric transmission line and three 345 KV electric
transmission lines as part of the CapX2020 project. The estimated cost of the four major transmission projects is $1.9 billion.
NSP-Minnesota and NSP-Wisconsin are responsible for approximately $1.1 billion of the total cost. The remainder of the costs
will be borne by other utilities in the upper Midwest. These cost estimates will be updated as the projects progress.
Hampton, Minn. to Rochester, Minn. to La Crosse, Wis. 345 KV transmission line
In May 2012, the MPUC issued a route permit for the Minnesota portion of the project. Two parties have filed an appeal with the
Minnesota Court of Appeals against the MPUC’s route permit decision. A decision by the Court is anticipated in mid-2013. In
May 2012, the PSCW issued a CPCN for the Wisconsin portion of the project. Subsequent legal challenges to the PSCW’s order
by intervenors were unsuccessful, thereby rendering the PSCW’s decision final. Construction on the project started in Minnesota
in January 2013 and the project is expected to go into service in 2015.
Monticello, Minn. to Fargo, N.D. 345 KV transmission line
In December 2011, the Monticello, Minn. to St. Cloud, Minn. portion of the Monticello, Minn. to Fargo, N.D. project was placed
in service. The MPUC issued a route permit for the Minnesota portion of the St. Cloud, Minn. to Fargo, N.D. section in June
2011. The NDPSC granted a CPCN in January 2011 and a certificate of corridor compatibility and route permit for the portion of
the line in North Dakota in September 2012. In January 2013, construction started on the project in North Dakota.