Xcel Energy 2012 Annual Report Download - page 110
Download and view the complete annual report
Please find page 110 of the 2012 Xcel Energy annual report below. You can navigate through the pages in the report by either clicking on the pages listed below, or by using the keyword search tool below to find specific information within the annual report.-
 1
1 -
2
-
3
-
4
-
5
-
6
-
7
-
8
-
9
-
10
-
11
-
12
-
13
-
14
-
15
-
16
-
17
-
18
-
19
-
20
-
21
-
22
-
23
-
24
-
25
-
26
-
27
-
28
-
29
-
30
-
31
-
32
-
33
-
34
-
35
-
36
-
37
-
38
-
39
-
40
-
41
-
42
-
43
-
44
-
45
-
46
-
47
-
48
-
49
-
50
-
51
-
52
-
53
-
54
-
55
-
56
-
57
-
58
-
59
-
60
-
61
-
62
-
63
-
64
-
65
-
66
-
67
-
68
-
69
-
70
-
71
-
72
-
73
-
74
-
75
-
76
-
77
-
78
-
79
-
80
-
81
-
82
-
83
-
84
-
85
-
86
-
87
-
88
-
89
-
90
-
91
-
92
-
93
-
94
-
95
-
96
-
97
-
98
-
99
-
 100
100 -
 101
101 -
 102
102 -
 103
103 -
 104
104 -
 105
105 -
 106
106 -
 107
107 -
 108
108 -
 109
109 -
 110
110 -
 111
111 -
 112
112 -
 113
113 -
 114
114 -
 115
115 -
 116
116 -
 117
117 -
 118
118 -
 119
119 -
 120
120 -
121
-
122
-
123
-
124
-
125
-
126
-
127
-
128
-
129
-
130
-
131
-
132
-
133
-
134
-
135
-
136
-
137
-
138
-
139
-
140
-
141
-
142
-
143
-
144
-
145
-
146
-
147
-
148
-
149
-
150
-
151
-
152
-
153
-
154
-
155
-
156
-
157
-
158
-
159
-
160
-
161
-
162
-
163
-
164
-
165
-
166
-
167
-
168
-
169
-
170
-
171
-
172
 |
 |

100
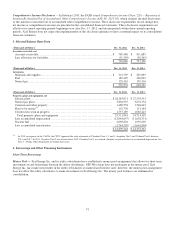
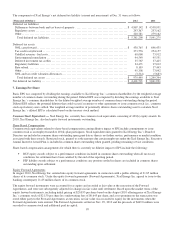
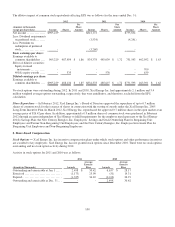
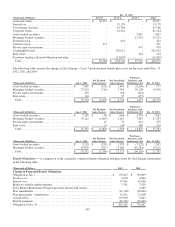
The dilutive impact of common stock equivalents affecting EPS was as follows for the years ended Dec. 31:
2012
2011
2010
Per
Per
Per
(Amounts in thousands,
Share
Share
Share
except per share data)
Income
Shares
Amount
Income
Shares
Amount
Income
Shares
Amount
Net income ...............
$
905,229
$841,172
$
755,834
Less: Dividend requirements
on preferred stock........
-
(3,534)
(4,241
)
Less: Premium on
redemption of preferred
stock....................
-
(3,260)
-
Basic earnings per share:
Earnings available to
common shareholders ....
905,229
487,899
$ 1.86
834,378
485,039
$
1.72
751,593
462,052
$
1.63
Effect of dilutive securities:
Equity forward
instruments ............
-
-
-
-
-
700
401(k) equity awards .....
-
535
-
576
-
639
Diluted earnings per share:
Earnings available to
common shareholders ....
$
905,229
488,434
$ 1.85
$834,378
485,615
$
1.72
$
751,593
463,391
$
1.62
No stock options were outstanding during 2012. In 2011 and 2010, Xcel Energy Inc. had approximately 2.1 million and 5.4
million weighted average options outstanding, respectively, that were antidilutive, and therefore, excluded from the EPS
calculation.
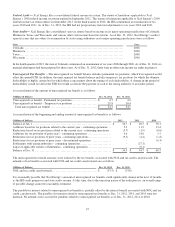
Share Repurchase — In February 2012, Xcel Energy Inc.’s Board of Directors approved the repurchase of up to 0.7 million
shares of common stock for the issuance of shares in connection with the vesting of awards under the Xcel Energy Inc. 2005
Long-Term Incentive Plan. In March 2012, Xcel Energy Inc. repurchased the approved 0.7 million shares in the open market at an
average price of $26.42 per share. In addition, approximately 0.9 million shares of common stock were purchased in February
2012 through an agent independent of Xcel Energy to fulfill requirements for the employer match pursuant to the Xcel Energy
401(k) Savings Plan; the New Century Energies, Inc. Employees’ Savings and Stock Ownership Plan for Bargaining Unit
Employees and Former Non-Bargaining Unit Employees; and the New Century Energies, Inc. Employee Investment Plan for
Bargaining Unit Employees and Non-Bargaining Employees.
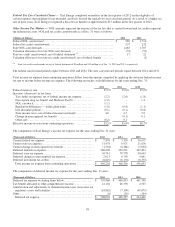
8. Share-Based Compensation
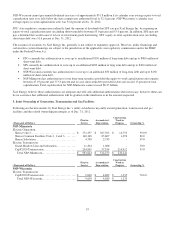
Stock Options — Xcel Energy Inc. has incentive compensation plans under which stock options and other performance incentives
are awarded to key employees. Xcel Energy Inc. has not granted stock options since December 2001. There were no stock options
outstanding and no stock option activity during 2012.
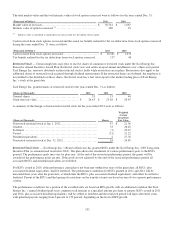
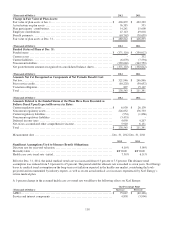
Activity in stock options for 2011 and 2010 was as follows:
2011
2010
Average
Average
Exercise
Exercise
(Awards in Thousands)
Awards
Price
Awards
Price
Outstanding and exercisable at Jan. 1.....
2,498
$
30.42
6,657
$
28.17
Exercised ..............................
(1,173
)
25.90
(51)
19.31
Expired ................................
(1,325
)
34.42
(4,108)
26.91
Outstanding and exercisable at Dec. 31 ...
-
-
2,498
30.42