Xcel Energy 2012 Annual Report Download - page 122
Download and view the complete annual report
Please find page 122 of the 2012 Xcel Energy annual report below. You can navigate through the pages in the report by either clicking on the pages listed below, or by using the keyword search tool below to find specific information within the annual report.-
 1
1 -
2
-
3
-
4
-
5
-
6
-
7
-
8
-
9
-
10
-
11
-
12
-
13
-
14
-
15
-
16
-
17
-
18
-
19
-
20
-
21
-
22
-
23
-
24
-
25
-
26
-
27
-
28
-
29
-
30
-
31
-
32
-
33
-
34
-
35
-
36
-
37
-
38
-
39
-
40
-
41
-
42
-
43
-
44
-
45
-
46
-
47
-
48
-
49
-
50
-
51
-
52
-
53
-
54
-
55
-
56
-
57
-
58
-
59
-
60
-
61
-
62
-
63
-
64
-
65
-
66
-
67
-
68
-
69
-
70
-
71
-
72
-
73
-
74
-
75
-
76
-
77
-
78
-
79
-
80
-
81
-
82
-
83
-
84
-
85
-
86
-
87
-
88
-
89
-
90
-
91
-
92
-
93
-
94
-
95
-
96
-
97
-
98
-
99
-
100
-
101
-
102
-
103
-
104
-
105
-
106
-
107
-
108
-
109
-
110
-
111
-
 112
112 -
 113
113 -
 114
114 -
 115
115 -
 116
116 -
 117
117 -
 118
118 -
 119
119 -
 120
120 -
 121
121 -
 122
122 -
 123
123 -
 124
124 -
 125
125 -
 126
126 -
 127
127 -
 128
128 -
 129
129 -
 130
130 -
 131
131 -
 132
132 -
133
-
134
-
135
-
136
-
137
-
138
-
139
-
140
-
141
-
142
-
143
-
144
-
145
-
146
-
147
-
148
-
149
-
150
-
151
-
152
-
153
-
154
-
155
-
156
-
157
-
158
-
159
-
160
-
161
-
162
-
163
-
164
-
165
-
166
-
167
-
168
-
169
-
170
-
171
-
172
 |
 |

112
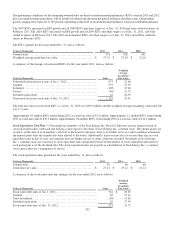
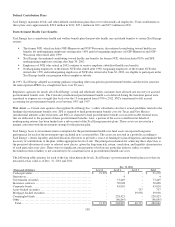
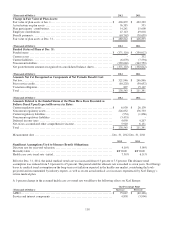
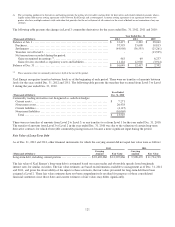
Contributions to multiemployer plans were as follows for the years ended Dec. 31, 2012, 2011 and 2010. There were no
significant changes to the nature or magnitude of the participation of NSP-Minnesota and NSP-Wisconsin in multiemployer plans
for the years presented:
(Thousands of Dollars)
2012
2011
2010
Multiemployer pension contributions:
NSP-Minnesota................................
......
$ 14,984
$ 17,811
$ 13,461
NSP-Wisconsin................................
......
163
169
170
Total ................................
..............
$ 15,147
$ 17,980
$ 13,631
Multiemployer other postretirement benefit contributions:
NSP-Minnesota................................
......
$ 197
$ 336
$ 153
Total ................................
..............
$ 197
$ 336
$ 153
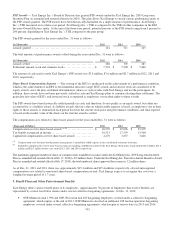
10. Other Income, Net
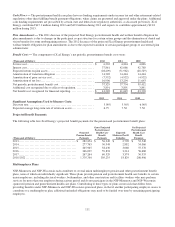
Other income, net for the years ended Dec. 31 consisted of the following:
(Thousands of Dollars)
2012
2011
2010
Interest income ................................
.......
$
10,327
$
10,639
$
11,023
COLI settlement................................
......
-
-
25,000
Other nonoperating income
............................
3,483
3,722
1,689
Insurance policy expense
..............................
(7,365
)
(4,785
)
(6,529
)
Other nonoperating expense
...........................
(270
)
(321
)
(40
)
Other income, net ................................
...
$
6,175
$
9,255
$
31,143
COLI — In 2010, Xcel Energy Inc., PSCo and PSRI entered into a settlement agreement with Provident related to all claims
asserted by Xcel Energy Inc., PSCo and PSRI against Provident in a lawsuit associated with the discontinued COLI program.
Under the terms of the settlement, Xcel Energy Inc., PSCo and PSRI were paid $25 million by Provident and Reassure America
Life Insurance Company in 2010. The $25 million proceeds were not subject to income taxes.
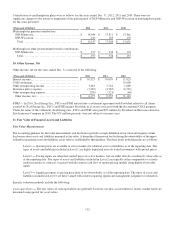
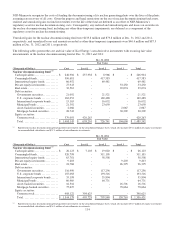
11. Fair Value of Financial Assets and Liabilities
Fair Value Measurements
The accounting guidance for fair value measurements and disclosures provides a single definition of fair value and requires certain
disclosures about assets and liabilities measured at fair value. A hierarchical framework for disclosing the observability of the inputs
utilized in measuring assets and liabilities at fair value is established by this guidance. The three levels in the hierarchy are as follows:
Level 1 — Quoted prices are available in active markets for identical assets or liabilities as of the reporting date. The
types of assets and liabilities included in Level 1 are highly liquid and actively traded instruments with quoted prices.
Level 2 — Pricing inputs are other than quoted prices in active markets, but are either directly or indirectly observable as
of the reporting date. The types of assets and liabilities included in Level 2 are typically either comparable to actively
traded securities or contracts, or priced with discounted cash flow or option pricing models using highly observable
inputs.
Level 3 — Significant inputs to pricing have little or no observability as of the reporting date. The types of assets and
liabilities included in Level 3 are those valued with models requiring significant management judgment or estimation.
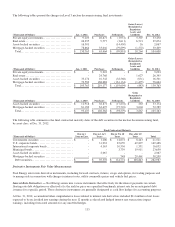
Specific valuation methods include the following:
Cash equivalents — The fair values of cash equivalents are generally based on cost plus accrued interest; money market funds are
measured using quoted net asset values.