Xcel Energy 2012 Annual Report Download - page 131
Download and view the complete annual report
Please find page 131 of the 2012 Xcel Energy annual report below. You can navigate through the pages in the report by either clicking on the pages listed below, or by using the keyword search tool below to find specific information within the annual report.-
 1
1 -
2
-
3
-
4
-
5
-
6
-
7
-
8
-
9
-
10
-
11
-
12
-
13
-
14
-
15
-
16
-
17
-
18
-
19
-
20
-
21
-
22
-
23
-
24
-
25
-
26
-
27
-
28
-
29
-
30
-
31
-
32
-
33
-
34
-
35
-
36
-
37
-
38
-
39
-
40
-
41
-
42
-
43
-
44
-
45
-
46
-
47
-
48
-
49
-
50
-
51
-
52
-
53
-
54
-
55
-
56
-
57
-
58
-
59
-
60
-
61
-
62
-
63
-
64
-
65
-
66
-
67
-
68
-
69
-
70
-
71
-
72
-
73
-
74
-
75
-
76
-
77
-
78
-
79
-
80
-
81
-
82
-
83
-
84
-
85
-
86
-
87
-
88
-
89
-
90
-
91
-
92
-
93
-
94
-
95
-
96
-
97
-
98
-
99
-
100
-
101
-
102
-
103
-
104
-
105
-
106
-
107
-
108
-
109
-
110
-
111
-
112
-
113
-
114
-
115
-
116
-
117
-
118
-
119
-
120
-
 121
121 -
 122
122 -
 123
123 -
 124
124 -
 125
125 -
 126
126 -
 127
127 -
 128
128 -
 129
129 -
 130
130 -
 131
131 -
 132
132 -
 133
133 -
 134
134 -
 135
135 -
 136
136 -
 137
137 -
 138
138 -
 139
139 -
 140
140 -
 141
141 -
142
-
143
-
144
-
145
-
146
-
147
-
148
-
149
-
150
-
151
-
152
-
153
-
154
-
155
-
156
-
157
-
158
-
159
-
160
-
161
-
162
-
163
-
164
-
165
-
166
-
167
-
168
-
169
-
170
-
171
-
172
 |
 |
121
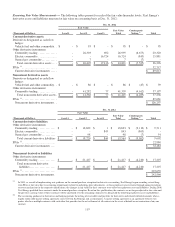
(b) The accounting guidance for derivatives and hedging permits the netting of receivables and payables for derivatives and related collateral amounts when a
legally enforceable master netting agreement exists between Xcel Energy and a counterparty. A master netting agreement is an agreement between two
parties who have multiple contracts with each other that provides for the net settlement of all contracts in the event of default on or termination of any one
contract.
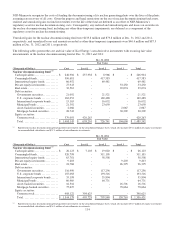
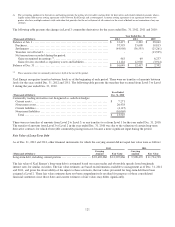
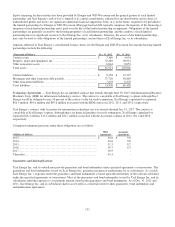
The following table presents the changes in Level 3 commodity derivatives for the years ended Dec. 31, 2012, 2011 and 2010:
Year Ended Dec. 31
(Thousands of Dollars)
2012
2011
2010
Balance at Jan. 1 ................................
.............................
$
12,417
$
2,392
$
28,042
Purchases ................................................................
..
37,595
33,609
10,813
Settlements ................................
................................
(44,950
)
(36,555)
(25,261)
Transfers out of Level 3................................
.....................
-
-
(13,525)
Net transactions recorded during the period:
Gains recognized in earnings (a) ................................
............
463
69
6,237
Gains (losses) recorded as regulatory assets and liabilities
....................
11,124
12,902
(3,914)
Balance at Dec. 31................................
............................
$
16,649
$
12,417
$
2,392
(a) These amounts relate to commodity derivatives held at the end of the period.
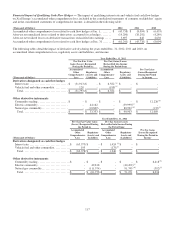
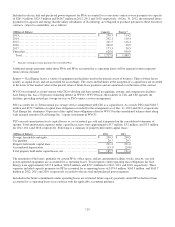
Xcel Energy recognizes transfers between levels as of the beginning of each period. There were no transfers of amounts between
levels for the years ended Dec. 31, 2012 and 2011. The following table presents the transfers that occurred from Level 3 to Level
2 during the year ended Dec. 31, 2010.
Year Ended
(Thousands of Dollars) Dec. 31, 2010
Commodity trading derivatives not designated as cash flow hedges:
Current assets .............................................................
$
7,271
Noncurrent assets..........................................................
26,438
Current liabilities ..........................................................
(4,115)
Noncurrent liabilities ......................................................
(16,069)
Total ...................................................................
$
13,525
There were no transfers of amounts from Level 2 to Level 3, or any transfers to or from Level 1 for the year ended Dec. 31, 2010.
The transfer of amounts from Level 3 to Level 2 in the year ended Dec. 31, 2010 was due to the valuation of certain long-term
derivative contracts for which observable commodity pricing forecasts became a more significant input during the period.
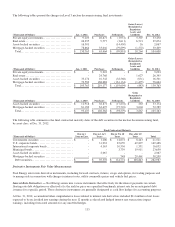
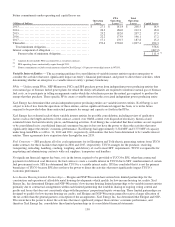
Fair Value of Long-Term Debt
As of Dec. 31, 2012 and 2011, other financial instruments for which the carrying amount did not equal fair value were as follows:
2012
2011
(Thousands of Dollars)
Carrying
Amount
Fair Value
Carrying
Amount
Fair Value
Long-term debt, including current portion
........................
$
10,402,060
$
12,207,866
$
9,908,435
$
11,734,798
The fair value of Xcel Energy’s long-term debt is estimated based on recent trades and observable spreads from benchmark
interest rates for similar securities. The fair value estimates are based on information available to management as of Dec. 31, 2012
and 2011, and given the observability of the inputs to these estimates, the fair values presented for long-term debt have been
assigned a Level 2. These fair value estimates have not been comprehensively revalued for purposes of these consolidated
financial statements since those dates and current estimates of fair values may differ significantly.