Xcel Energy 2012 Annual Report Download - page 168
Download and view the complete annual report
Please find page 168 of the 2012 Xcel Energy annual report below. You can navigate through the pages in the report by either clicking on the pages listed below, or by using the keyword search tool below to find specific information within the annual report.-
 1
1 -
2
-
3
-
4
-
5
-
6
-
7
-
8
-
9
-
10
-
11
-
12
-
13
-
14
-
15
-
16
-
17
-
18
-
19
-
20
-
21
-
22
-
23
-
24
-
25
-
26
-
27
-
28
-
29
-
30
-
31
-
32
-
33
-
34
-
35
-
36
-
37
-
38
-
39
-
40
-
41
-
42
-
43
-
44
-
45
-
46
-
47
-
48
-
49
-
50
-
51
-
52
-
53
-
54
-
55
-
56
-
57
-
58
-
59
-
60
-
61
-
62
-
63
-
64
-
65
-
66
-
67
-
68
-
69
-
70
-
71
-
72
-
73
-
74
-
75
-
76
-
77
-
78
-
79
-
80
-
81
-
82
-
83
-
84
-
85
-
86
-
87
-
88
-
89
-
90
-
91
-
92
-
93
-
94
-
95
-
96
-
97
-
98
-
99
-
100
-
101
-
102
-
103
-
104
-
105
-
106
-
107
-
108
-
109
-
110
-
111
-
112
-
113
-
114
-
115
-
116
-
117
-
118
-
119
-
120
-
121
-
122
-
123
-
124
-
125
-
126
-
127
-
128
-
129
-
130
-
131
-
132
-
133
-
134
-
135
-
136
-
137
-
138
-
139
-
140
-
141
-
142
-
143
-
144
-
145
-
146
-
147
-
148
-
149
-
150
-
151
-
152
-
153
-
154
-
155
-
156
-
157
-
 158
158 -
 159
159 -
 160
160 -
 161
161 -
 162
162 -
 163
163 -
 164
164 -
 165
165 -
 166
166 -
 167
167 -
 168
168 -
 169
169 -
 170
170 -
 171
171 -
 172
172
 |
 |

158
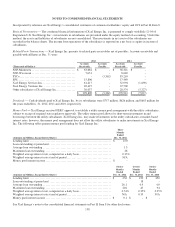
NOTES TO CONDENSED FINANCIAL STATEMENTS
Incorporated by reference are Xcel Energy’s consolidated statements of common stockholders’ equity and OCI in Part II, Item 8.
Basis of Presentation — The condensed financial information of Xcel Energy Inc. is presented to comply with Rule 12-04 of
Regulation S-X. Xcel Energy Inc.’s investments in subsidiaries are presented under the equity method of accounting. Under this
method, the assets and liabilities of subsidiaries are not consolidated. The investments in net assets of the subsidiaries are
recorded in the balance sheets. The income from operations of the subsidiaries is reported on a net basis as equity in income of
subsidiaries.
Related Party Transactions — Xcel Energy Inc. presents its related party receivables net of payables. Accounts receivable and
payable with affiliates at Dec. 31 were:
2012
2011
Accounts
Accounts
Accounts
Accounts
(Thousands of Dollars)
Receivable
Payable
Receivable
Payable
NSP-Minnesota ...................................
$
63,682
$
-
$
58,321
$
-
NSP-Wisconsin ...................................
7,631
-
8,620
-
PSCo .............................................
-
(3,362)
83,263
-
SPS ..............................................
15,806
-
17,440
-
Xcel Energy Services Inc. ..........................
61,217
-
52,994
(1,690
)
Xcel Energy Ventures Inc. .........................
20,427
-
37,700
-
Other subsidiaries of Xcel Energy Inc................
30,037
-
20,574
(5,327
)
$
198,800
$
(3,362)
$
278,912
$
(7,017
)
Dividends — Cash dividends paid to Xcel Energy Inc. by its subsidiaries were $757 million, $626 million, and $663 million for
the years ended Dec. 31, 2012, 2011 and 2010, respectively.
Money Pool — Xcel Energy received FERC approval to establish a utility money pool arrangement with the utility subsidiaries,
subject to receipt of required state regulatory approvals. The utility money pool allows for short-term investments in and
borrowings between the utility subsidiaries. Xcel Energy Inc. may make investments in the utility subsidiaries at market-based
interest rates; however, the money pool arrangement does not allow the utility subsidiaries to make investments in Xcel Energy
Inc. The following tables present money pool lending for Xcel Energy Inc.:
(Amounts in Millions, Except Interest Rates)
Three
Months
Ended
Dec. 31, 2012
Lending limit...................................................................
$
250
Loan outstanding at period end ..................................................
-
Average loan outstanding .......................................................
1.3
Maximum loan outstanding......................................................
26
Weighted average interest rate, computed on a daily basis ..........................
0.33%
Weighted average interest rate at end of period ....................................
N/A
Money pool interest income .....................................................
$
-
(Amounts in Millions, Except Interest Rates)
Twelve
Months
Ended
Dec. 31, 2012
Twelve
Months
Ended
Dec. 31, 2011
Twelve
Months
Ended
Dec. 31, 2010
Lending limit...................................................................
$
250
$
250
$ 250
Loan outstanding at period end ..................................................
-
18
-
Average loan outstanding .......................................................
26.1
0.4
4.0
Maximum loan outstanding......................................................
226
43
94
Weighted average interest rate, computed on a daily basis ..........................
0.33%
0.35
%
0.35%
Weighted average interest rate at end of period ....................................
N/A
0.35
N/A
Money pool interest income .....................................................
$
0.1
$
-
$ -
See Xcel Energy’s notes to the consolidated financial statements in Part II, Item 8 for other disclosures.