Xcel Energy 2012 Annual Report Download - page 119
Download and view the complete annual report
Please find page 119 of the 2012 Xcel Energy annual report below. You can navigate through the pages in the report by either clicking on the pages listed below, or by using the keyword search tool below to find specific information within the annual report.-
 1
1 -
2
-
3
-
4
-
5
-
6
-
7
-
8
-
9
-
10
-
11
-
12
-
13
-
14
-
15
-
16
-
17
-
18
-
19
-
20
-
21
-
22
-
23
-
24
-
25
-
26
-
27
-
28
-
29
-
30
-
31
-
32
-
33
-
34
-
35
-
36
-
37
-
38
-
39
-
40
-
41
-
42
-
43
-
44
-
45
-
46
-
47
-
48
-
49
-
50
-
51
-
52
-
53
-
54
-
55
-
56
-
57
-
58
-
59
-
60
-
61
-
62
-
63
-
64
-
65
-
66
-
67
-
68
-
69
-
70
-
71
-
72
-
73
-
74
-
75
-
76
-
77
-
78
-
79
-
80
-
81
-
82
-
83
-
84
-
85
-
86
-
87
-
88
-
89
-
90
-
91
-
92
-
93
-
94
-
95
-
96
-
97
-
98
-
99
-
100
-
101
-
102
-
103
-
104
-
105
-
106
-
107
-
108
-
 109
109 -
 110
110 -
 111
111 -
 112
112 -
 113
113 -
 114
114 -
 115
115 -
 116
116 -
 117
117 -
 118
118 -
 119
119 -
 120
120 -
 121
121 -
 122
122 -
 123
123 -
 124
124 -
 125
125 -
 126
126 -
 127
127 -
 128
128 -
 129
129 -
130
-
131
-
132
-
133
-
134
-
135
-
136
-
137
-
138
-
139
-
140
-
141
-
142
-
143
-
144
-
145
-
146
-
147
-
148
-
149
-
150
-
151
-
152
-
153
-
154
-
155
-
156
-
157
-
158
-
159
-
160
-
161
-
162
-
163
-
164
-
165
-
166
-
167
-
168
-
169
-
170
-
171
-
172
 |
 |

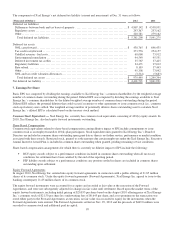
109
Dec. 31, 2011
(Thousands of Dollars)
Level 1
Level 2
Level 3
Total
Cash equivalents ................................
...............
$
58,037
$
-
$
-
$
58,037
Derivatives................................
.....................
-
13,178
-
13,178
Government securities ................................
..........
-
65,746
-
65,746
Corporate bonds ................................
................
-
61,524
-
61,524
Asset-backed securities ................................
.........
-
-
7,867
7,867
Mortgage-backed securities................................
......
-
-
27,253
27,253
Preferred stock ................................
.................
-
423
-
423
Common stock ................................
.................
351
-
-
351
Private equity investments................................
.......
-
-
479
479
Commingled funds ................................
.............
-
202,912
-
202,912
Real estate ................................
.....................
-
-
144
144
Securities lending collateral obligation and other
..................
-
(11,079
)
-
(11,079)
Total................................
.........................
$
58,388
$
332,704
$
35,743
$
426,835
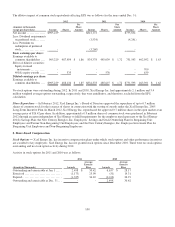
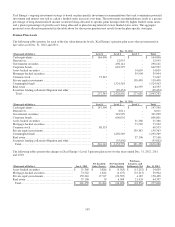
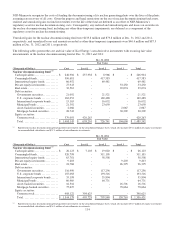
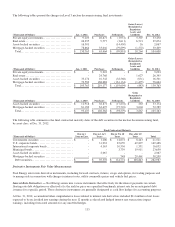
The following tables present the changes in Xcel Energy’s Level 3 postretirement benefit plan assets for the years ended Dec. 31,
2012, 2011 and 2010:
Purchases,
Net Realized
Net Unrealized
Issuances, and
(Thousands of Dollars)
Jan. 1, 2012
Gains (Losses)
Gains (Losses)
Settlements, Net
Dec. 31, 2012
Asset-backed securities
..........................
$ 7,867
$ (331
)
$
1,481
$
(8,260
)
$
757
Mortgage-backed securities
.......................
27,253
(724
)
3,301
10,128
39,958
Private equity investments
........................
479
-
(65
)
(414
)
-
Real estate ................................
......
144
-
35
(179
)
-
Total................................
..........
$ 35,743
$ (1,055
)
$
4,752
$
1,275
$
40,715
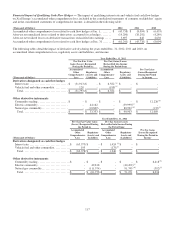
Purchases,
Net Realized
Net Unrealized
Issuances, and
(Thousands of Dollars)
Jan. 1, 2011
Gains (Losses)
Gains (Losses)
Settlements, Net
Dec. 31, 2011
Asset-backed securities
..........................
$ 2,585
$ (10
)
$
(664
)
$
5,956
$
7,867
Mortgage-backed securities
.......................
19,212
(1,669
)
2,623
7,087
27,253
Private equity investments
........................
-
12
53
414
479
Real estate ................................
......
-
(2
)
(34
)
180
144
Total................................
..........
$ 21,797
$ (1,669
)
$
1,978
$
13,637
$
35,743
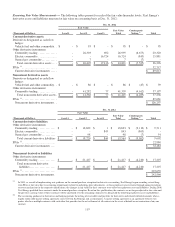
Purchases,
Net Realized
Net Unrealized
Issuances, and
(Thousands of Dollars)
Jan. 1, 2010
Gains (Losses)
Gains (Losses)
Settlements, Net
Dec. 31, 2010
Asset-backed securities
..........................
$ 8,293
$ (259
)
$
2,073
$
(7,522
)
$
2,585
Mortgage-backed securities
.......................
47,078
(927
)
15,642
(42,581
)
19,212
Total................................
..........
$ 55,371
$ (1,186
)
$
17,715
$
(50,103
)
$
21,797
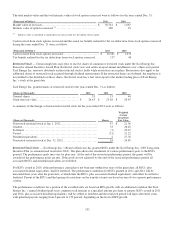
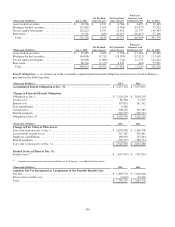
Benefit Obligations — A comparison of the actuarially computed benefit obligation and plan assets for Xcel Energy is presented
in the following table:
(Thousands of Dollars)
2012
2011
Change in Projected Benefit Obligation:
Obligation at Jan. 1 ................................
..............................
$
776,847
$
794,905
Service cost ................................................................
.....
4,203
4,824
Interest cost ................................................................
.....
37,861
42,086
Medicare subsidy reimbursements ................................
................
3,741
3,518
Early Retiree Reinsurance Program proceeds shared with retirees
....................
-
4,269
Plan amendments ................................
................................
(41,128)
(26,630
)
Plan participants’ contributions ................................
...................
14,241
15,690
Actuarial loss ................................................................
...
119,949
8,823
Benefit payments ................................
................................
(63,762)
(70,638
)
Obligation at Dec. 31 ................................
............................
$
851,952
$
776,847