Xcel Energy 2012 Annual Report Download - page 64
Download and view the complete annual report
Please find page 64 of the 2012 Xcel Energy annual report below. You can navigate through the pages in the report by either clicking on the pages listed below, or by using the keyword search tool below to find specific information within the annual report.-
 1
1 -
2
-
3
-
4
-
5
-
6
-
7
-
8
-
9
-
10
-
11
-
12
-
13
-
14
-
15
-
16
-
17
-
18
-
19
-
20
-
21
-
22
-
23
-
24
-
25
-
26
-
27
-
28
-
29
-
30
-
31
-
32
-
33
-
34
-
35
-
36
-
37
-
38
-
39
-
40
-
41
-
42
-
43
-
44
-
45
-
46
-
47
-
48
-
49
-
50
-
51
-
52
-
53
-
 54
54 -
 55
55 -
 56
56 -
 57
57 -
 58
58 -
 59
59 -
 60
60 -
 61
61 -
 62
62 -
 63
63 -
 64
64 -
 65
65 -
 66
66 -
 67
67 -
 68
68 -
 69
69 -
 70
70 -
 71
71 -
 72
72 -
 73
73 -
 74
74 -
75
-
76
-
77
-
78
-
79
-
80
-
81
-
82
-
83
-
84
-
85
-
86
-
87
-
88
-
89
-
90
-
91
-
92
-
93
-
94
-
95
-
96
-
97
-
98
-
99
-
100
-
101
-
102
-
103
-
104
-
105
-
106
-
107
-
108
-
109
-
110
-
111
-
112
-
113
-
114
-
115
-
116
-
117
-
118
-
119
-
120
-
121
-
122
-
123
-
124
-
125
-
126
-
127
-
128
-
129
-
130
-
131
-
132
-
133
-
134
-
135
-
136
-
137
-
138
-
139
-
140
-
141
-
142
-
143
-
144
-
145
-
146
-
147
-
148
-
149
-
150
-
151
-
152
-
153
-
154
-
155
-
156
-
157
-
158
-
159
-
160
-
161
-
162
-
163
-
164
-
165
-
166
-
167
-
168
-
169
-
170
-
171
-
172
 |
 |

54
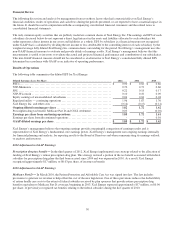
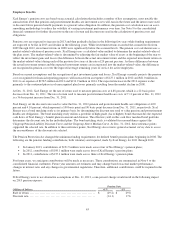
The percentage increase (decrease) in normal and actual HDD, CDD and THI are provided in the following table:
2012 vs.
2011 vs.
2012 vs.
2010 vs.
2011 vs.
Normal
Normal
2011
Normal (a)
2010 (a)
HDD
...............................
(15.9) %
(1.0
) %
(14.8) %
(4.3) %
3.5
%
CDD
...............................
46.1
38.1
5.7
11.9
23.4
THI
................................
36.1
37.9
0.2
29.9
6.1
(a) Adjusted for the October 2010 sale of SPS electric distribution assets to the city of Lubbock, Texas.
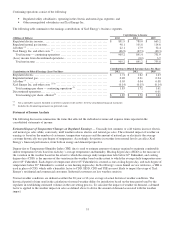
Weather — The following table summarizes the estimated impact of temperature variations on EPS compared with sales under
normal weather conditions:
2012 vs.
2011 vs.
2012 vs.
2010 vs.
2011 vs.
Normal
Normal
2011
Normal
2010
Retail electric
.......................
$
0.081
$
0.080
$
0.001
$
0.040
$
0.040
Firm natural gas
.....................
(0.033)
0.002
(0.035)
(0.010
)
0.012
Total
.............................
$
0.048
$
0.082
$
(0.034)
$
0.030
$
0.052
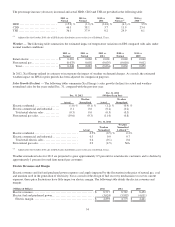
In 2012, Xcel Energy refined its estimate to incorporate the impact of weather on demand charges. As a result, the estimated
weather impact on EPS for prior periods has been adjusted for comparison purposes.
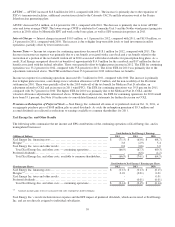
Sales Growth (Decline) — The following tables summarize Xcel Energy’s sales growth (decline) for actual and weather-
normalized sales for the years ended Dec. 31, compared with the previous year:
Dec. 31, 2012
Dec. 31, 2012
(Without Leap Day)
Weather
Weather
Actual
Normalized
Actual
Normalized
Electric residential .................... (1.0) %
(0.1) %
(1.2) %
(0.4) %
Electric commercial and industrial ..... 0.1
0.0
(0.2)
(0.2)
Total retail electric sales ............ (0.3)
0.0
(0.5)
(0.3)
Firm natural gas sales ................. (10.6)
(0.3)
(11.0)
(0.8)
Dec. 31, 2011
Weather
Weather
Normalized
Actual
Normalized
Lubbock (a)
Electric residential ...................................
0.5
%
(0.5
) %
0.2
%
Electric commercial and industrial ....................
0.3
0.0
0.7
Total retail electric sales ...........................
0.4
(0.1
)
0.6
Firm natural gas sales ................................
0.9
(2.5
)
N/A
(a) Adjusted for the October 2010 sale of SPS electric distribution assets to the city of Lubbock, Texas.
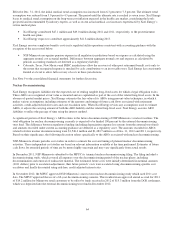
Weather-normalized sales for 2013 are projected to grow approximately 0.5 percent for retail electric customers and to decline by
approximately 1 percent for retail firm natural gas customers.
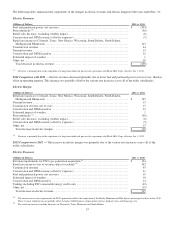
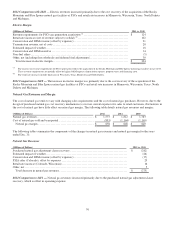
Electric Revenues and Margin
Electric revenues and fuel and purchased power expenses are largely impacted by the fluctuation in the price of natural gas, coal
and uranium used in the generation of electricity, but as a result of the design of fuel recovery mechanisms to recover current
expenses, these price fluctuations have little impact on electric margin. The following table details the electric revenues and
margin:
(Millions of Dollars)
2012
2011
2010
Electric revenues ................................
.................
$
8,517
$
8,767
$
8,452
Electric fuel and purchased power................................
..
(3,624
)
(3,992
)
(4,011
)
Electric margin ................................
.................
$
4,893
$
4,775
$
4,441