Xcel Energy 2011 Annual Report Download - page 90
Download and view the complete annual report
Please find page 90 of the 2011 Xcel Energy annual report below. You can navigate through the pages in the report by either clicking on the pages listed below, or by using the keyword search tool below to find specific information within the annual report.-
 1
1 -
2
-
3
-
4
-
5
-
6
-
7
-
8
-
9
-
10
-
11
-
12
-
13
-
14
-
15
-
16
-
17
-
18
-
19
-
20
-
21
-
22
-
23
-
24
-
25
-
26
-
27
-
28
-
29
-
30
-
31
-
32
-
33
-
34
-
35
-
36
-
37
-
38
-
39
-
40
-
41
-
42
-
43
-
44
-
45
-
46
-
47
-
48
-
49
-
50
-
51
-
52
-
53
-
54
-
55
-
56
-
57
-
58
-
59
-
60
-
61
-
62
-
63
-
64
-
65
-
66
-
67
-
68
-
69
-
70
-
71
-
72
-
73
-
74
-
75
-
76
-
77
-
78
-
79
-
 80
80 -
 81
81 -
 82
82 -
 83
83 -
 84
84 -
 85
85 -
 86
86 -
 87
87 -
 88
88 -
 89
89 -
 90
90 -
 91
91 -
 92
92 -
 93
93 -
 94
94 -
 95
95 -
 96
96 -
 97
97 -
 98
98 -
 99
99 -
 100
100 -
101
-
102
-
103
-
104
-
105
-
106
-
107
-
108
-
109
-
110
-
111
-
112
-
113
-
114
-
115
-
116
-
117
-
118
-
119
-
120
-
121
-
122
-
123
-
124
-
125
-
126
-
127
-
128
-
129
-
130
-
131
-
132
-
133
-
134
-
135
-
136
-
137
-
138
-
139
-
140
-
141
-
142
-
143
-
144
-
145
-
146
-
147
-
148
-
149
-
150
-
151
-
152
-
153
-
154
-
155
-
156
-
157
-
158
-
159
-
160
-
161
-
162
-
163
-
164
-
165
 |
 |

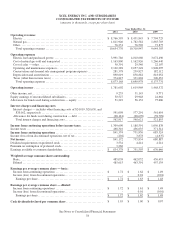
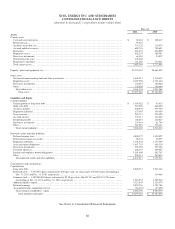
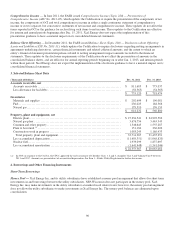
80
XCEL ENERGY INC. AND SUBSIDIARIES
CONSOLIDATED BALANCE SHEETS
(amounts in thousands, except share and per share data)
Dec. 31
2011 2010
Assets
Current assets
Cash and cash equivalents.................................................................. $
60,684 $
108,437
Restricted cash .......................................................................... 95,287 -
Accounts receivable, net ................................................................... 753,120 718,474
Accrued unbilled revenues ................................................................. 688,740 708,691
Inventories ............................................................................. 618,232 560,800
Regulatory assets ........................................................................ 402,235 388,541
Derivative instruments .................................................................... 64,340 54,079
Deferred income taxes .................................................................... 178,446 -
Prepayments and other .................................................................... 121,480 193,621
Total current assets ....................................................................... 2,982,564 2,732,643
Property, plant and equipment, net.............................................................. 22,353,367 20,663,082
Other assets
Nuclear decommissioning fund and other investments ............................................. 1,463,515 1,476,435
Regulatory assets ........................................................................ 2,389,008 2,151,460
Derivative instruments .................................................................... 152,887 184,026
Other ................................................................................. 155,926 180,044
Total other assets ...................................................................... 4,161,336 3,991,965
Total assets ........................................................................ $
29,497,267 $
27,387,690
Liabilities and Equity
Current liabilities
Current portion of long-term debt ............................................................ $
1,059,922 $
55,415
Short-term debt.......................................................................... 219,000 466,400
Accounts payable ........................................................................ 902,078 979,750
Regulatory liabilities...................................................................... 275,095 156,038
Taxes accrued........................................................................... 289,713 254,320
Accrued interest ......................................................................... 177,111 163,907
Dividends payable ....................................................................... 126,487 122,847
Derivative instruments .................................................................... 157,414 61,745
Other ................................................................................. 381,819 276,111
Total current liabilities .................................................................. 3,588,639 2,536,533
Deferred credits and other liabilities
Deferred income taxes .................................................................... 4,020,377 3,390,027
Deferred investment tax credits .............................................................. 86,743 92,937
Regulatory liabilities...................................................................... 1,101,534 1,179,765
Asset retirement obligations ................................................................ 1,651,793 969,310
Derivative instruments .................................................................... 263,906 285,986
Customer advances....................................................................... 248,345 269,087
Pension and employee benefit obligations ...................................................... 1,001,906 962,767
Other ................................................................................. 203,313 249,635
Total deferred credits and other liabilities .................................................... 8,577,917 7,399,514
Commitments and contingencies
Capitalization
Long-term debt.......................................................................... 8,848,513 9,263,144
Preferred stock — 7,000,000 shares authorized of $100 par value; no shares and 1,049,800 shares outstanding at
Dec. 31, 2011 and Dec. 31, 2010, respectively ................................................. - 104,980
Common stock — 1,000,000,000 shares authorized of $2.50 par value; 486,493,933 and 482,333,750 shares
outstanding at Dec. 31, 2011 and Dec. 31, 2010, respectively ...................................... 1,216,234 1,205,834
Additional paid in capital .................................................................. 5,327,443 5,229,075
Retained earnings ........................................................................ 2,032,556 1,701,703
Accumulated other comprehensive loss ........................................................ (94,035) (53,093)
Total common stockholders’ equity ......................................................... 8,482,198 8,083,519
Total liabilities and equity.............................................................. $
29,497,267 $
27,387,690
See Notes to Consolidated Financial Statements