Xcel Energy 2011 Annual Report Download - page 79
Download and view the complete annual report
Please find page 79 of the 2011 Xcel Energy annual report below. You can navigate through the pages in the report by either clicking on the pages listed below, or by using the keyword search tool below to find specific information within the annual report.-
 1
1 -
2
-
3
-
4
-
5
-
6
-
7
-
8
-
9
-
10
-
11
-
12
-
13
-
14
-
15
-
16
-
17
-
18
-
19
-
20
-
21
-
22
-
23
-
24
-
25
-
26
-
27
-
28
-
29
-
30
-
31
-
32
-
33
-
34
-
35
-
36
-
37
-
38
-
39
-
40
-
41
-
42
-
43
-
44
-
45
-
46
-
47
-
48
-
49
-
50
-
51
-
52
-
53
-
54
-
55
-
56
-
57
-
58
-
59
-
60
-
61
-
62
-
63
-
64
-
65
-
66
-
67
-
68
-
 69
69 -
 70
70 -
 71
71 -
 72
72 -
 73
73 -
 74
74 -
 75
75 -
 76
76 -
 77
77 -
 78
78 -
 79
79 -
 80
80 -
 81
81 -
 82
82 -
 83
83 -
 84
84 -
 85
85 -
 86
86 -
 87
87 -
 88
88 -
 89
89 -
90
-
91
-
92
-
93
-
94
-
95
-
96
-
97
-
98
-
99
-
100
-
101
-
102
-
103
-
104
-
105
-
106
-
107
-
108
-
109
-
110
-
111
-
112
-
113
-
114
-
115
-
116
-
117
-
118
-
119
-
120
-
121
-
122
-
123
-
124
-
125
-
126
-
127
-
128
-
129
-
130
-
131
-
132
-
133
-
134
-
135
-
136
-
137
-
138
-
139
-
140
-
141
-
142
-
143
-
144
-
145
-
146
-
147
-
148
-
149
-
150
-
151
-
152
-
153
-
154
-
155
-
156
-
157
-
158
-
159
-
160
-
161
-
162
-
163
-
164
-
165
 |
 |

69
See discussion of trends, commitments and uncertainties with the potential for future impact on cash flow and liquidity under
Capital Sources.
Capital Requirements
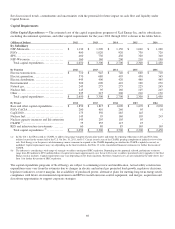
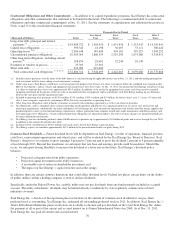
Utility Capital Expenditures — The estimated cost of the capital expenditure programs of Xcel Energy Inc. and its subsidiaries,
excluding discontinued operations, and other capital requirements for the years 2012 through 2016 is shown in the tables below.
(Millions of Dollars)
2012 2013 2014 2015 2016
By Subsidiary
NSP-Minnesota ..........................
$
1,130 $
1,390 $
1,150 $
1,040 $
1,200
PSCo ....................................
900 1,020 920 730 720
SPS .....................................
460 730 430 320 340
NSP-Wisconsin ..........................
160 160 200 210 190
Total capital expenditures ...............
$
2,650 $
3,300 $
2,700 $
2,300 $
2,450
By Function
2012 2013 2014 2015 2016
Electric transmission......................
$
710 $
945 $
740 $
660 $
710
Electric generation........................
570 680 495 450 345
Electric distribution .......................
445 400 420 460 465
Environmental ...........................
300 690 410 190 270
Natural gas...............................
245 275 275 225 245
Nuclear fuel..............................
145 95 160 105 245
Other ....................................
235 215 200 210 170
Total capital expenditures ...............
$
2,650 $
3,300 $
2,700 $
2,300 $
2,450
By Project 2012 2013 2014 2015 2016
Base and other capital expenditures ........
$
1,850 $
1,815 $
1,690 $
1,670
$
2,030
PSCo CACJA ............................
200 410 260
95
10
CapX2020 ...............................
175 350 285
145
-
Nuclear fuel..............................
145 95 160
105
245
Nuclear capacity increases and life extension
145 295 105
95
-
CSAPR (a)................................
75 255 115
25
-
RES and infrastructure investments ........
60 80 85
165
165
Total capital expenditures (b) .............
$
2,650 $
3,300 $
2,700 $
2,300
$
2,450
(a) In July 2011, the EPA issued its CSAPR, to address long range transport of particulate matter and ozone by requiring reductions in SO2 and NOx from
utilities located in the eastern half of the U.S. On Dec. 30, 2011, the D.C. Circuit issued a stay of the CSAPR, pending completion of judicial review of the
rule. Xcel Energy is in the process of determining various scenarios to respond to the CSAPR depending on whether the CSAPR is upheld, reversed, or
modified. Capital requirements may vary depending on the final resolution. See Note 13 to the consolidated financial statements for further discussion of
CSAPR.
(b) The industry is considering a wide range of strategies to address anticipated NRC regulation. Depending on the approach selected, preliminary estimates
range from $20 million to $250 million dollars of capital investment approximately over the next five years to address postulated safety upgrades to the Xcel
Energy nuclear facilities. Capital requirements may vary depending on the final regulation, therefore estimated costs are not included in the table above. See
Item 1 for further discussion of NRC regulation.
The capital expenditure programs of Xcel Energy are subject to continuing review and modification. Actual utility construction
expenditures may vary from the estimates due to changes in electric and natural gas projected load growth, regulatory decisions,
legislative initiatives, reserve margins, the availability of purchased power, alternative plans for meeting long-term energy needs,
compliance with future environmental requirements and RPS to install emission-control equipment, and merger, acquisition and
divestiture opportunities to support corporate strategies.