Xcel Energy 2011 Annual Report Download - page 149
Download and view the complete annual report
Please find page 149 of the 2011 Xcel Energy annual report below. You can navigate through the pages in the report by either clicking on the pages listed below, or by using the keyword search tool below to find specific information within the annual report.-
 1
1 -
2
-
3
-
4
-
5
-
6
-
7
-
8
-
9
-
10
-
11
-
12
-
13
-
14
-
15
-
16
-
17
-
18
-
19
-
20
-
21
-
22
-
23
-
24
-
25
-
26
-
27
-
28
-
29
-
30
-
31
-
32
-
33
-
34
-
35
-
36
-
37
-
38
-
39
-
40
-
41
-
42
-
43
-
44
-
45
-
46
-
47
-
48
-
49
-
50
-
51
-
52
-
53
-
54
-
55
-
56
-
57
-
58
-
59
-
60
-
61
-
62
-
63
-
64
-
65
-
66
-
67
-
68
-
69
-
70
-
71
-
72
-
73
-
74
-
75
-
76
-
77
-
78
-
79
-
80
-
81
-
82
-
83
-
84
-
85
-
86
-
87
-
88
-
89
-
90
-
91
-
92
-
93
-
94
-
95
-
96
-
97
-
98
-
99
-
100
-
101
-
102
-
103
-
104
-
105
-
106
-
107
-
108
-
109
-
110
-
111
-
112
-
113
-
114
-
115
-
116
-
117
-
118
-
119
-
120
-
121
-
122
-
123
-
124
-
125
-
126
-
127
-
128
-
129
-
130
-
131
-
132
-
133
-
134
-
135
-
136
-
137
-
138
-
 139
139 -
 140
140 -
 141
141 -
 142
142 -
 143
143 -
 144
144 -
 145
145 -
 146
146 -
 147
147 -
 148
148 -
 149
149 -
 150
150 -
 151
151 -
 152
152 -
 153
153 -
 154
154 -
 155
155 -
 156
156 -
 157
157 -
 158
158 -
 159
159 -
160
-
161
-
162
-
163
-
164
-
165
 |
 |

139
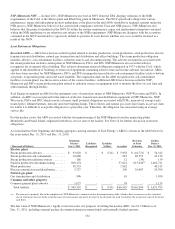
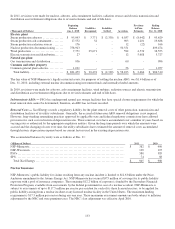
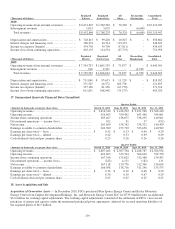
(Thousands of Dollars) Regulated
Electric Regulated
Natural Gas
All
Other Reconciling
Eliminations
Consolidated
Total
2010
Operating revenues from external customers
..........
$
8,451,845 $
1,782,582 $
76,520 $
- $
10,310,947
Intersegment revenues
..............................
1,015 5,653 - (6,668) -
Total revenues ................................
...
$
8,452,860 $
1,788,235 $
76,520 $
(6,668) $
10,310,947
Depreciation and amortization
.......................
$
748,815 $
99,220 $
10,847 $
- $
858,882
Interest charges and financing costs
..................
380,074 49,314 119,233 - 548,621
Income tax expense (benefit)
........................
434,756 59,790 (57,911) - 436,635
Income (loss) from continuing operations
.............
665,155 114,554 (27,753) - 751,956
(Thousands of Dollars)
Regulated
Electric
Regulated
Natural Gas
All
Other
Reconciling
Eliminations
Consolidated
Total
2009
Operating revenues from external customers
..........
$
7,704,723 $
1,865,703 $
73,877 $
- $
9,644,303
Intersegment revenues
..............................
816 2,931 - (3,747) -
Total revenues ................................
...
$
7,705,539 $
1,868,634 $
73,877 $
(3,747) $
9,644,303
Depreciation and amortization
.......................
$
711,090 $
95,633 $
11,329 $
- $
818,052
Interest charges and financing costs
..................
371,525 44,572 105,758 - 521,855
Income tax expense (benefit)
........................
357,128 81,956 (67,770) - 371,314
Income (loss) from continuing operations
.............
611,851 108,948 (35,275) - 685,524
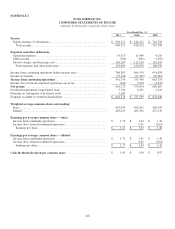
17. Summarized Quarterly Financial Data (Unaudited)
Quarter Ended
(Amounts in thousands, except per share data) March 31, 2011
June 30, 2011
Sept. 30, 2011
Dec. 31, 2011
Operating revenues ................................
.............
$
2,816,540 $ 2,438,222 $ 2,831,598 $ 2,568,410
Operating income................................
...............
426,663 359,442 651,496 344,001
Income from continuing operations
..............................
203,467 158,671 338,295 140,941
Discontinued operations — income (loss)
.........................
102 91 37 (432
)
Net income ................................
....................
203,569 158,762 338,332 140,509
Earnings available to common shareholders
.......................
202,509 157,702 333,658 140,509
Earnings per share total — basic ................................
.
$
0.42 $ 0.33 $ 0.69 $ 0.29
Earnings per share total — diluted
...............................
0.42 0.33 0.69 0.29
Cash dividends declared per common share
.......................
0.25 0.26 0.26 0.26
Quarter Ended
(Amounts in thousands, except per share data) March 31, 2010
June 30, 2010
Sept. 30, 2010
Dec. 31, 2010
Operating revenues ................................
.............
$
2,807,462 $ 2,307,764 $ 2,628,787 $ 2,566,934
Operating income................................
...............
403,665 325,304 568,630 322,370
Income from continuing operations
..............................
167,340 135,625 312,488 136,503
Discontinued operations — income (loss)
.........................
(222) 4,151 (182) 131
Net income ................................
....................
167,118 139,776 312,306 136,634
Earnings available to common shareholders
.......................
166,058 138,716 311,246 135,573
Earnings per share total — basic ................................
.
$
0.36 $ 0.30 $ 0.68 $ 0.29
Earnings per share total — diluted
...............................
0.36 0.30 0.67 0.29
Cash dividends declared per common share
.......................
0.25 0.25 0.25 0.25
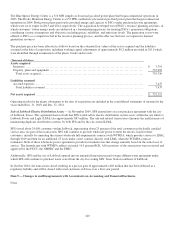
18. Asset Acquisition and Sale
Acquisition of Generation Assets — In December 2010, PSCo purchased Blue Spruce Energy Center and Rocky Mountain
Energy Center from Calpine Development Holdings, Inc. and Riverside Energy Center LLC for $739.0 million plus an additional
$3.0 million for working capital adjustments. The working capital adjustments consisted of the settlement of PSCo’s most recent
purchases of energy and capacity under the terminated purchased power agreements, adjusted for accrued operating liabilities of
the acquired plants of $6.5 million.