Xcel Energy 2011 Annual Report Download - page 84
Download and view the complete annual report
Please find page 84 of the 2011 Xcel Energy annual report below. You can navigate through the pages in the report by either clicking on the pages listed below, or by using the keyword search tool below to find specific information within the annual report.-
 1
1 -
2
-
3
-
4
-
5
-
6
-
7
-
8
-
9
-
10
-
11
-
12
-
13
-
14
-
15
-
16
-
17
-
18
-
19
-
20
-
21
-
22
-
23
-
24
-
25
-
26
-
27
-
28
-
29
-
30
-
31
-
32
-
33
-
34
-
35
-
36
-
37
-
38
-
39
-
40
-
41
-
42
-
43
-
44
-
45
-
46
-
47
-
48
-
49
-
50
-
51
-
52
-
53
-
54
-
55
-
56
-
57
-
58
-
59
-
60
-
61
-
62
-
63
-
64
-
65
-
66
-
67
-
68
-
69
-
70
-
71
-
72
-
73
-
 74
74 -
 75
75 -
 76
76 -
 77
77 -
 78
78 -
 79
79 -
 80
80 -
 81
81 -
 82
82 -
 83
83 -
 84
84 -
 85
85 -
 86
86 -
 87
87 -
 88
88 -
 89
89 -
 90
90 -
 91
91 -
 92
92 -
 93
93 -
 94
94 -
95
-
96
-
97
-
98
-
99
-
100
-
101
-
102
-
103
-
104
-
105
-
106
-
107
-
108
-
109
-
110
-
111
-
112
-
113
-
114
-
115
-
116
-
117
-
118
-
119
-
120
-
121
-
122
-
123
-
124
-
125
-
126
-
127
-
128
-
129
-
130
-
131
-
132
-
133
-
134
-
135
-
136
-
137
-
138
-
139
-
140
-
141
-
142
-
143
-
144
-
145
-
146
-
147
-
148
-
149
-
150
-
151
-
152
-
153
-
154
-
155
-
156
-
157
-
158
-
159
-
160
-
161
-
162
-
163
-
164
-
165
 |
 |
74
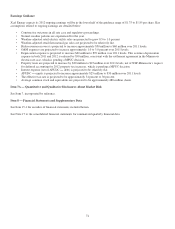
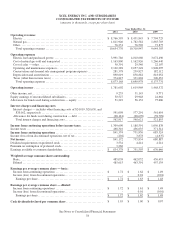
Earnings Guidance
Xcel Energy expects its 2012 ongoing earnings will be in the lower half of the guidance range of $1.75 to $1.85 per share. Key
assumptions related to ongoing earnings are detailed below:
• Constructive outcomes in all rate case and regulatory proceedings.
• Normal weather patterns are experienced for the year.
• Weather-adjusted retail electric utility sales are projected to grow 0.5 to 1.0 percent.
• Weather-adjusted retail firm natural gas sales are projected to be relatively flat.
• Rider revenue recovery is projected to increase approximately $50 million to $60 million over 2011 levels.
• O&M expenses are projected to increase approximately 1.0 to 3.0 percent over 2011 levels.
• Depreciation expense is projected to increase $60 million to $70 million over 2011 levels. This assumes depreciation
expense in both 2011 and 2012 is reduced by $30 million, consistent with the settlement agreement in the Minnesota
electric rate case, which is pending a MPUC decision.
• Property taxes are projected to increase by $20 million to $25 million over 2011 levels, net of NSP-Minnesota’s request
for deferred accounting for 2012 property tax increases, which is pending a MPUC decision.
• Interest expense (net of AFUDC — debt) is projected to be relatively flat.
• AFUDC — equity is projected to increase approximately $25 million to $30 million over 2011 levels.
• The effective tax rate is projected to be approximately 34 percent to 36 percent.
• Average common stock and equivalents are projected to be approximately 488 million shares.
Item 7A — Quantitative and Qualitative Disclosures About Market Risk
See Item 7, incorporated by reference.
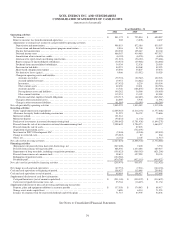
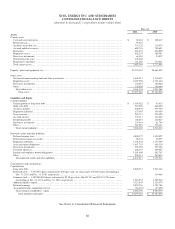
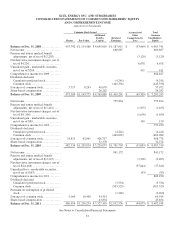
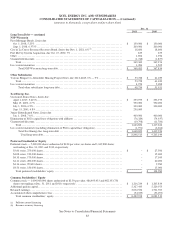
Item 8 — Financial Statements and Supplementary Data
See Item 15-1 for an index of financial statements included herein.
See Note 17 to the consolidated financial statements for summarized quarterly financial data.