Xcel Energy 2011 Annual Report Download - page 107
Download and view the complete annual report
Please find page 107 of the 2011 Xcel Energy annual report below. You can navigate through the pages in the report by either clicking on the pages listed below, or by using the keyword search tool below to find specific information within the annual report.-
 1
1 -
2
-
3
-
4
-
5
-
6
-
7
-
8
-
9
-
10
-
11
-
12
-
13
-
14
-
15
-
16
-
17
-
18
-
19
-
20
-
21
-
22
-
23
-
24
-
25
-
26
-
27
-
28
-
29
-
30
-
31
-
32
-
33
-
34
-
35
-
36
-
37
-
38
-
39
-
40
-
41
-
42
-
43
-
44
-
45
-
46
-
47
-
48
-
49
-
50
-
51
-
52
-
53
-
54
-
55
-
56
-
57
-
58
-
59
-
60
-
61
-
62
-
63
-
64
-
65
-
66
-
67
-
68
-
69
-
70
-
71
-
72
-
73
-
74
-
75
-
76
-
77
-
78
-
79
-
80
-
81
-
82
-
83
-
84
-
85
-
86
-
87
-
88
-
89
-
90
-
91
-
92
-
93
-
94
-
95
-
96
-
 97
97 -
 98
98 -
 99
99 -
 100
100 -
 101
101 -
 102
102 -
 103
103 -
 104
104 -
 105
105 -
 106
106 -
 107
107 -
 108
108 -
 109
109 -
 110
110 -
 111
111 -
 112
112 -
 113
113 -
 114
114 -
 115
115 -
 116
116 -
 117
117 -
118
-
119
-
120
-
121
-
122
-
123
-
124
-
125
-
126
-
127
-
128
-
129
-
130
-
131
-
132
-
133
-
134
-
135
-
136
-
137
-
138
-
139
-
140
-
141
-
142
-
143
-
144
-
145
-
146
-
147
-
148
-
149
-
150
-
151
-
152
-
153
-
154
-
155
-
156
-
157
-
158
-
159
-
160
-
161
-
162
-
163
-
164
-
165
 |
 |

97
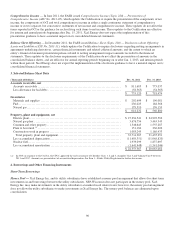
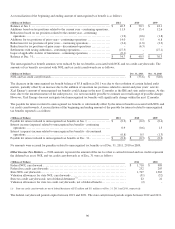
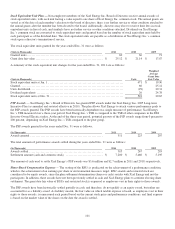
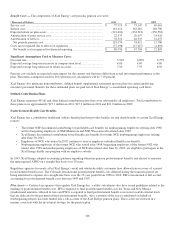
Total income tax expense from continuing operations differs from the amount computed by applying the statutory federal income
tax rate to income before income tax expense. The following reconciles such differences for the years ending Dec. 31:
2011 2010 2009
Federal statutory rate................................
.........................
35.0% 35.0% 35.0
%
Increases (decreases) in tax from:
State income taxes, net of federal income tax benefit
..........................
4.2 3.9 4.0
Resolution of income tax audits and other ................................
...
0.3 0.6 0.8
Tax credits recognized, net of federal income tax expense
.....................
(2.6) (1.8) (2.0)
Regulatory differences - utility plant items ................................
...
(0.8) (1.1) (2.0)
Change in unrecognized tax benefits ................................
........
(0.1) 0.1 (0.5)
Life insurance policies ................................
.....................
(0.1) (0.8) (0.2)
Previously recognized Medicare Part D subsidies
.............................
- 1.4 -
Other, net ................................
................................
(0.1) (0.6) -
Effective income tax rate from continuing operations
...........................
35.8% 36.7% 35.1
%
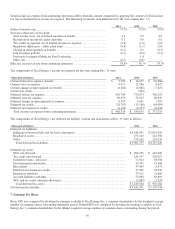
The components of Xcel Energy’s income tax expense for the years ending Dec. 31 were:
(Thousands of Dollars) 2011 2010 2009
Current federal tax expense (benefit) ................................
..........
$
3,399 $
16,657 $
(39,886)
Current state tax expense ................................
.....................
9,971 12,580 8,672
Current change in unrecognized tax benefit ................................
....
(8,266) (2,982) (7,627)
Current tax credits ................................
...........................
- (944) -
Deferred federal tax expense................................
..................
410,794 376,073 360,252
Deferred state tax expense................................
....................
80,670 52,543 69,947
Deferred change in unrecognized tax expense ................................
..
6,705 4,641 2,387
Deferred tax credits................................
..........................
(28,763) (15,580) (16,005)
Deferred investment tax credits ................................
...............
(6,194) (6,353) (6,426)
Total income tax expense from continuing operations
.........................
$
468,316 $
436,635 $
371,314
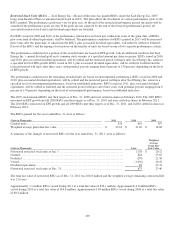
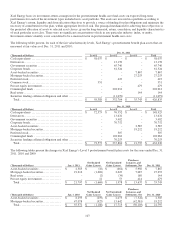
The components of Xcel Energy’s net deferred tax liability (current and noncurrent) at Dec. 31 were as follows:
(Thousands of Dollars) 2011 2010
Deferred tax liabilities:
Differences between book and tax bases of property ................................
........
$
4,558,951 $
3,853,425
Regulatory assets ................................................................
........
253,162 242,760
Other ................................................................
...................
279,162 219,035
Total deferred tax liabilities ................................
............................
$
5,091,275 $
4,315,220
Deferred tax assets:
NOL carryforward................................................................
.......
$
696,435 $
425,620
Tax credit carryforward ................................................................
..
254,157 226,057
Unbilled revenue - fuel costs ................................
.............................
73,912 69,358
Environmental remediation ................................
...............................
45,551 41,696
Rate refund ................................................................
.............
37,443 8,971
Deferred investment tax credits ................................
...........................
37,425 39,916
Regulatory liabilities................................................................
.....
37,012 51,600
Accrued liabilities and other ................................
..............................
73,092 58,891
NOL and tax credit valuation allowances ................................
..................
(5,683) (1,927)
Total deferred tax assets................................
................................
$
1,249,344 $
920,182
Net deferred tax liability ................................................................
...
$
3,841,931 $
3,395,038
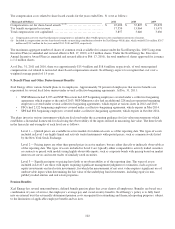
7. Earnings Per Share
Basic EPS was computed by dividing the earnings available to Xcel Energy Inc.’s common shareholders by the weighted average
number of common shares outstanding during the period. Diluted EPS was computed by dividing the earnings available to Xcel
Energy Inc.’s common shareholders by the diluted weighted average number of common shares outstanding during the period.