Xcel Energy 2011 Annual Report Download - page 162
Download and view the complete annual report
Please find page 162 of the 2011 Xcel Energy annual report below. You can navigate through the pages in the report by either clicking on the pages listed below, or by using the keyword search tool below to find specific information within the annual report.-
 1
1 -
2
-
3
-
4
-
5
-
6
-
7
-
8
-
9
-
10
-
11
-
12
-
13
-
14
-
15
-
16
-
17
-
18
-
19
-
20
-
21
-
22
-
23
-
24
-
25
-
26
-
27
-
28
-
29
-
30
-
31
-
32
-
33
-
34
-
35
-
36
-
37
-
38
-
39
-
40
-
41
-
42
-
43
-
44
-
45
-
46
-
47
-
48
-
49
-
50
-
51
-
52
-
53
-
54
-
55
-
56
-
57
-
58
-
59
-
60
-
61
-
62
-
63
-
64
-
65
-
66
-
67
-
68
-
69
-
70
-
71
-
72
-
73
-
74
-
75
-
76
-
77
-
78
-
79
-
80
-
81
-
82
-
83
-
84
-
85
-
86
-
87
-
88
-
89
-
90
-
91
-
92
-
93
-
94
-
95
-
96
-
97
-
98
-
99
-
100
-
101
-
102
-
103
-
104
-
105
-
106
-
107
-
108
-
109
-
110
-
111
-
112
-
113
-
114
-
115
-
116
-
117
-
118
-
119
-
120
-
121
-
122
-
123
-
124
-
125
-
126
-
127
-
128
-
129
-
130
-
131
-
132
-
133
-
134
-
135
-
136
-
137
-
138
-
139
-
140
-
141
-
142
-
143
-
144
-
145
-
146
-
147
-
148
-
149
-
150
-
151
-
 152
152 -
 153
153 -
 154
154 -
 155
155 -
 156
156 -
 157
157 -
 158
158 -
 159
159 -
 160
160 -
 161
161 -
 162
162 -
 163
163 -
 164
164 -
 165
165
 |
 |

152
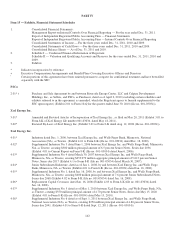
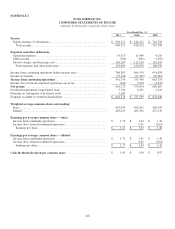
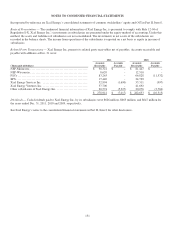
SCHEDULE II
XCEL ENERGY INC. AND SUBSIDIARIES
VALUATION AND QUALIFYING ACCOUNTS
YEARS ENDED DEC. 31, 2011, 2010 AND 2009
(amounts in thousands)
Additions
Balance at
Jan. 1
Charged to
Costs and
Expenses
Charged to
Other
Accounts (a) Deductions
from
Reserves (b) (c) Balance at
Dec. 31
Allowance for bad debts:
2011
................................
$
54,563 $
44,521 $
15,636 $
56,155 $
58,565
2010
................................
56,103 44,068 15,202 60,810 54,563
2009
................................
64,239 49,023 21,869 79,028 56,103
NOL and tax credit valuation
allowances:
2011
................................
$
1,927 $
4,379 $
- $
623 $
5,683
2010
................................
9,324 240 - 7,637 1,927
2009
................................
2,044 7,280 - - 9,324
(a) Recovery of amounts previously written off as related to allowance for bad debts.
(b) Principally bad debts written off or transferred as related to allowance for bad debts.
(c) Reductions to valuation allowances for NOL and tax credit carryforwards primarily due to changes in tax laws and expirations of certain carryforwards.