Xcel Energy 2011 Annual Report Download - page 160
Download and view the complete annual report
Please find page 160 of the 2011 Xcel Energy annual report below. You can navigate through the pages in the report by either clicking on the pages listed below, or by using the keyword search tool below to find specific information within the annual report.-
 1
1 -
2
-
3
-
4
-
5
-
6
-
7
-
8
-
9
-
10
-
11
-
12
-
13
-
14
-
15
-
16
-
17
-
18
-
19
-
20
-
21
-
22
-
23
-
24
-
25
-
26
-
27
-
28
-
29
-
30
-
31
-
32
-
33
-
34
-
35
-
36
-
37
-
38
-
39
-
40
-
41
-
42
-
43
-
44
-
45
-
46
-
47
-
48
-
49
-
50
-
51
-
52
-
53
-
54
-
55
-
56
-
57
-
58
-
59
-
60
-
61
-
62
-
63
-
64
-
65
-
66
-
67
-
68
-
69
-
70
-
71
-
72
-
73
-
74
-
75
-
76
-
77
-
78
-
79
-
80
-
81
-
82
-
83
-
84
-
85
-
86
-
87
-
88
-
89
-
90
-
91
-
92
-
93
-
94
-
95
-
96
-
97
-
98
-
99
-
100
-
101
-
102
-
103
-
104
-
105
-
106
-
107
-
108
-
109
-
110
-
111
-
112
-
113
-
114
-
115
-
116
-
117
-
118
-
119
-
120
-
121
-
122
-
123
-
124
-
125
-
126
-
127
-
128
-
129
-
130
-
131
-
132
-
133
-
134
-
135
-
136
-
137
-
138
-
139
-
140
-
141
-
142
-
143
-
144
-
145
-
146
-
147
-
148
-
149
-
 150
150 -
 151
151 -
 152
152 -
 153
153 -
 154
154 -
 155
155 -
 156
156 -
 157
157 -
 158
158 -
 159
159 -
 160
160 -
 161
161 -
 162
162 -
 163
163 -
 164
164 -
 165
165
 |
 |

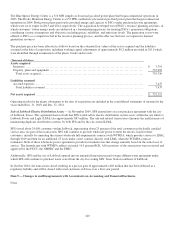
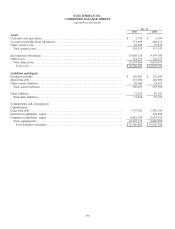
150
XCEL ENERGY INC.
CONDENSED BALANCE SHEETS
(amounts in thousands)
Dec. 31
2011 2010
Assets
Cash and cash equivalents ................................
...............................
$
2,719
$
9,654
Accounts receivable from subsidiaries ................................
....................
271,895
266,323
Other current assets................................................................
.....
28,399
35,276
Total current assets ................................................................
...
303,013
311,253
Investment in subsidiaries ................................
...............................
10,089,116
9,559,780
Other assets ................................................................
............
154,353
134,157
Total other assets ................................................................
.....
10,243,469
9,693,937
Total assets ................................................................
........
$
10,546,482
$
10,005,190
Liabilities and Equity
Dividends payable ................................................................
......
$
126,487
$
122,847
Short-term debt................................................................
.........
127,000
148,000
Other current liabilities................................................................
..
36,000
24,453
Total current liabilities ................................
................................
289,487
295,300
Other liabilities................................................................
.........
31,616
29,192
Total other liabilities................................................................
..
31,616
29,192
Commitments and contingencies
Capitalization
Long-term debt................................................................
.........
1,743,181
1,492,199
Preferred stockholders’ equity ................................
...........................
-
104,980
Common stockholders’ equity ................................
...........................
8,482,198
8,083,519
Total capitalization ................................................................
...
10,225,379
9,680,698
Total liabilities and equity ................................
...........................
$
10,546,482
$
10,005,190