Under Armour 2015 Annual Report Download - page 62
Download and view the complete annual report
Please find page 62 of the 2015 Under Armour annual report below. You can navigate through the pages in the report by either clicking on the pages listed below, or by using the keyword search tool below to find specific information within the annual report.-
 1
1 -
2
-
3
-
4
-
5
-
6
-
7
-
8
-
9
-
10
-
11
-
12
-
13
-
14
-
15
-
16
-
17
-
18
-
19
-
20
-
21
-
22
-
23
-
24
-
25
-
26
-
27
-
28
-
29
-
30
-
31
-
32
-
33
-
34
-
35
-
36
-
37
-
38
-
39
-
40
-
41
-
42
-
43
-
44
-
45
-
46
-
47
-
48
-
49
-
50
-
51
-
 52
52 -
 53
53 -
 54
54 -
 55
55 -
 56
56 -
 57
57 -
 58
58 -
 59
59 -
 60
60 -
 61
61 -
 62
62 -
 63
63 -
 64
64 -
 65
65 -
 66
66 -
 67
67 -
 68
68 -
 69
69 -
 70
70 -
 71
71 -
 72
72 -
73
-
74
-
75
-
76
-
77
-
78
-
79
-
80
-
81
-
82
-
83
-
84
-
85
-
86
-
87
-
88
-
89
-
90
-
91
-
92
-
93
-
94
-
95
-
96
-
97
-
98
-
99
-
100
-
101
-
102
-
103
-
104
 |
 |

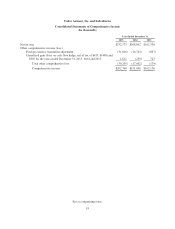
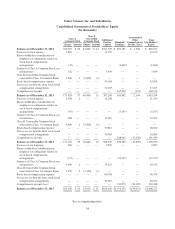
Under Armour, Inc. and Subsidiaries
Consolidated Statements of Stockholders’ Equity
(In thousands)
Class A
Common Stock
Class B
Convertible
Common Stock Additional
Paid-In
Capital
Retained
Earnings
Accumulated
Other
Comprehensive
Income (Loss)
Total
Stockholders’
EquityShares Amount Shares Amount
Balance as of December 31, 2012 166,922 $ 56 42,600 $ 14 $321,303 $ 493,181 $ 2,368 $ 816,922
Exercise of stock options 1,822 — — — 12,159 — — 12,159
Shares withheld in consideration of
employee tax obligations relative to
stock-based compensation
arrangements (47) — — — — (1,669) — (1,669)
Issuance of Class A Common Stock, net
of forfeitures 332 — — — 3,439 — — 3,439
Class B Convertible Common Stock
converted to Class A Common Stock 2,600 1 (2,600) (1) — — — —
Stock-based compensation expense — — — — 43,184 — — 43,184
Net excess tax benefits from stock-based
compensation arrangements — — — — 17,163 — — 17,163
Comprehensive income — — — — — 162,330 (174) 162,156
Balance as of December 31, 2013 171,629 57 40,000 13 397,248 653,842 2,194 1,053,354
Exercise of stock options 1,454 1 — — 11,258 — — 11,259
Shares withheld in consideration of
employee tax obligations relative to
stock-based compensation
arrangements (95) — — — — (5,197) — (5,197)
Issuance of Class A Common Stock, net
of forfeitures 908 — — — 12,067 — — 12,067
Class B Convertible Common Stock
converted to Class A Common Stock 3,400 1 (3,400) (1) — — — —
Stock-based compensation expense — — — — 50,812 — — 50,812
Net excess tax benefits from stock-based
compensation arrangements — — — — 36,965 — — 36,965
Comprehensive income — — — — — 208,042 (17,002) 191,040
Balance as of December 31, 2014 177,296 59 36,600 12 508,350 856,687 (14,808) 1,350,300
Exercise of stock options 360 — — — 2,852 — — 2,852
Shares withheld in consideration of
employee tax obligations relative to
stock-based compensation
arrangements (172) — — — — (12,727) — (12,727)
Issuance of Class A Common Stock, net
of forfeitures 1,996 1 — — 19,135 — — 19,136
Class B Convertible Common Stock
converted to Class A Common Stock 2,150 1 (2,150) (1) — — — —
Stock-based compensation expense — — — — 60,376 — — 60,376
Net excess tax benefits from stock-based
compensation arrangements — — — — 45,917 — — 45,917
Comprehensive income (loss) — — — — — 232,573 (30,205) 202,368
Balance as of December 31, 2015 181,630 $ 61 34,450 $ 11 $636,630 $1,076,533 $(45,013) $1,668,222
See accompanying notes.
54