Under Armour 2015 Annual Report Download - page 37
Download and view the complete annual report
Please find page 37 of the 2015 Under Armour annual report below. You can navigate through the pages in the report by either clicking on the pages listed below, or by using the keyword search tool below to find specific information within the annual report.-
 1
1 -
2
-
3
-
4
-
5
-
6
-
7
-
8
-
9
-
10
-
11
-
12
-
13
-
14
-
15
-
16
-
17
-
18
-
19
-
20
-
21
-
22
-
23
-
24
-
25
-
26
-
 27
27 -
 28
28 -
 29
29 -
 30
30 -
 31
31 -
 32
32 -
 33
33 -
 34
34 -
 35
35 -
 36
36 -
 37
37 -
 38
38 -
 39
39 -
 40
40 -
 41
41 -
 42
42 -
 43
43 -
 44
44 -
 45
45 -
 46
46 -
 47
47 -
48
-
49
-
50
-
51
-
52
-
53
-
54
-
55
-
56
-
57
-
58
-
59
-
60
-
61
-
62
-
63
-
64
-
65
-
66
-
67
-
68
-
69
-
70
-
71
-
72
-
73
-
74
-
75
-
76
-
77
-
78
-
79
-
80
-
81
-
82
-
83
-
84
-
85
-
86
-
87
-
88
-
89
-
90
-
91
-
92
-
93
-
94
-
95
-
96
-
97
-
98
-
99
-
100
-
101
-
102
-
103
-
104
 |
 |

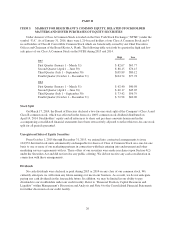
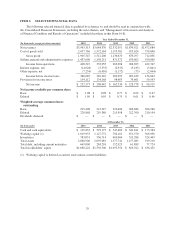
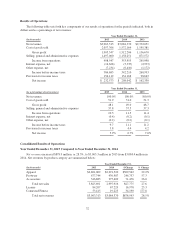
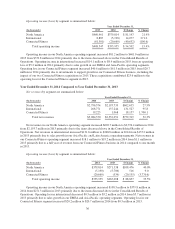
ITEM 6. SELECTED FINANCIAL DATA
The following selected financial data is qualified by reference to, and should be read in conjunction with,
the Consolidated Financial Statements, including the notes thereto, and “Management’s Discussion and Analysis
of Financial Condition and Results of Operations” included elsewhere in this Form 10-K.
Year Ended December 31,
(In thousands, except per share amounts) 2015 2014 2013 2012 2011
Net revenues $3,963,313 $3,084,370 $2,332,051 $1,834,921 $1,472,684
Cost of goods sold 2,057,766 1,572,164 1,195,381 955,624 759,848
Gross profit 1,905,547 1,512,206 1,136,670 879,297 712,836
Selling, general and administrative expenses 1,497,000 1,158,251 871,572 670,602 550,069
Income from operations 408,547 353,955 265,098 208,695 162,767
Interest expense, net (14,628) (5,335) (2,933) (5,183) (3,841)
Other expense, net (7,234) (6,410) (1,172) (73) (2,064)
Income before income taxes 386,685 342,210 260,993 203,439 156,862
Provision for income taxes 154,112 134,168 98,663 74,661 59,943
Net income $ 232,573 $ 208,042 $ 162,330 $ 128,778 $ 96,919
Net income available per common share
Basic $ 1.08 $ 0.98 $ 0.77 $ 0.62 $ 0.47
Diluted $ 1.05 $ 0.95 $ 0.75 $ 0.61 $ 0.46
Weighted average common shares
outstanding
Basic 215,498 213,227 210,696 208,686 206,280
Diluted 220,868 219,380 215,958 212,760 210,104
Dividends declared $ — $ — $ — $ — $ —
At December 31,
(In thousands) 2015 2014 2013 2012 2011
Cash and cash equivalents $ 129,852 $ 593,175 $ 347,489 $ 341,841 $ 175,384
Working capital (1) 1,019,953 1,127,772 702,181 651,370 506,056
Inventories 783,031 536,714 469,006 319,286 324,409
Total assets 2,868,900 2,095,083 1,577,741 1,157,083 919,210
Total debt, including current maturities 669,000 284,201 152,923 61,889 77,724
Total stockholders’ equity $1,668,222 $1,350,300 $1,053,354 $ 816,922 $ 636,432
(1) Working capital is defined as current assets minus current liabilities.
29