Under Armour 2015 Annual Report Download - page 45
Download and view the complete annual report
Please find page 45 of the 2015 Under Armour annual report below. You can navigate through the pages in the report by either clicking on the pages listed below, or by using the keyword search tool below to find specific information within the annual report.-
 1
1 -
2
-
3
-
4
-
5
-
6
-
7
-
8
-
9
-
10
-
11
-
12
-
13
-
14
-
15
-
16
-
17
-
18
-
19
-
20
-
21
-
22
-
23
-
24
-
25
-
26
-
27
-
28
-
29
-
30
-
31
-
32
-
33
-
34
-
 35
35 -
 36
36 -
 37
37 -
 38
38 -
 39
39 -
 40
40 -
 41
41 -
 42
42 -
 43
43 -
 44
44 -
 45
45 -
 46
46 -
 47
47 -
 48
48 -
 49
49 -
 50
50 -
 51
51 -
 52
52 -
 53
53 -
 54
54 -
 55
55 -
56
-
57
-
58
-
59
-
60
-
61
-
62
-
63
-
64
-
65
-
66
-
67
-
68
-
69
-
70
-
71
-
72
-
73
-
74
-
75
-
76
-
77
-
78
-
79
-
80
-
81
-
82
-
83
-
84
-
85
-
86
-
87
-
88
-
89
-
90
-
91
-
92
-
93
-
94
-
95
-
96
-
97
-
98
-
99
-
100
-
101
-
102
-
103
-
104
 |
 |

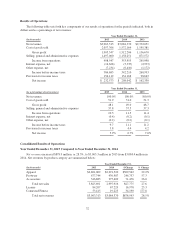
Seasonality
Historically, we have recognized a majority of our net revenues and a significant portion of our income from
operations in the last two quarters of the year, driven primarily by increased sales volume of our products during
the fall selling season, including our higher priced cold weather products, along with a larger proportion of
higher margin direct to consumer sales. The level of our working capital generally reflects the seasonality and
growth in our business. We generally expect inventory, accounts payable and certain accrued expenses to be
higher in the second and third quarters in preparation for the fall selling season.
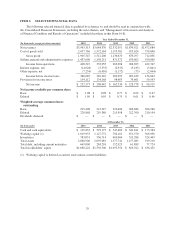
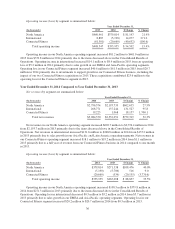
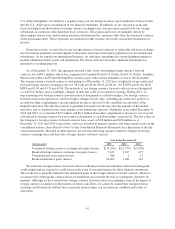
The following table sets forth certain financial information for the periods indicated. The data is prepared on
the same basis as the audited consolidated financial statements included elsewhere in this Form 10-K. All
recurring, necessary adjustments are reflected in the data below.
Quarter Ended (unaudited)
(In thousands)
Mar 31,
2014
Jun 30,
2014
Sep 30,
2014
Dec 31,
2014
Mar 31,
2015
Jun 30,
2015
Sep 30,
2015
Dec 31,
2015
Net revenues $641,607 $609,654 $937,908 $895,201 $804,941 $783,577 $1,204,109 $1,170,686
Gross profit 300,690 299,952 465,300 446,264 377,664 379,053 587,160 561,670
Marketing SG&A expenses 87,977 70,854 99,756 74,462 107,632 89,553 128,467 92,154
Other SG&A expenses 185,857 194,404 219,438 225,503 242,365 257,599 287,296 291,933
Income from operations 26,856 34,694 146,106 146,299 27,667 31,901 171,397 177,582
(As a percentage of annual totals)
Net revenues 20.8% 19.8% 30.4% 29.0% 20.3% 19.8% 30.4% 29.5%
Gross profit 19.9% 19.8% 30.8% 29.5% 19.8% 19.9% 30.8% 29.5%
Marketing SG&A expenses 26.4% 21.3% 29.9% 22.4% 25.8% 21.4% 30.7% 22.1%
Other SG&A expenses 22.5% 23.6% 26.6% 27.3% 22.5% 23.9% 26.6% 27.1%
Income from operations 7.6% 9.8% 41.3% 41.3% 6.8% 7.8% 42.0% 43.5%
Financial Position, Capital Resources and Liquidity
Our cash requirements have principally been for working capital and capital expenditures. We fund our
working capital, primarily inventory, and capital investments from cash flows from operating activities, cash and
cash equivalents on hand and borrowings available under our credit and long term debt facilities. Our working
capital requirements generally reflect the seasonality and growth in our business as we recognize the majority of
our net revenues in the back half of the year. Our capital investments have included expanding our in-store
fixture and branded concept shop program, improvements and expansion of our distribution and corporate
facilities to support our growth, leasehold improvements to our new brand and factory house stores, and
investment and improvements in information technology systems.
Our inventory strategy is focused on continuing to meet consumer demand while improving our inventory
efficiency over the long term by putting systems and processes in place to improve our inventory management.
These systems and processes are designed to improve our forecasting and supply planning capabilities. In
addition to systems and processes, key areas of focus that we believe will enhance inventory performance are
added discipline around the purchasing of product, production lead time reduction, and better planning and
execution in selling of excess inventory through our factory house stores and other liquidation channels.
We believe our cash and cash equivalents on hand, cash from operations and borrowings available to us
under our credit agreement and other financing instruments are adequate to meet our liquidity needs and capital
expenditure requirements for at least the next twelve months. Although we believe we have adequate sources of
liquidity over the long term, an economic recession or a slow recovery could adversely affect our business and
liquidity (refer to the “Risk Factors” section included in Item 1A). In addition, instability in or tightening of the
capital markets could adversely affect our ability to obtain additional capital to grow our business on terms
acceptable to us or at all.
37