Under Armour 2015 Annual Report Download - page 47
Download and view the complete annual report
Please find page 47 of the 2015 Under Armour annual report below. You can navigate through the pages in the report by either clicking on the pages listed below, or by using the keyword search tool below to find specific information within the annual report.-
 1
1 -
2
-
3
-
4
-
5
-
6
-
7
-
8
-
9
-
10
-
11
-
12
-
13
-
14
-
15
-
16
-
17
-
18
-
19
-
20
-
21
-
22
-
23
-
24
-
25
-
26
-
27
-
28
-
29
-
30
-
31
-
32
-
33
-
34
-
35
-
36
-
 37
37 -
 38
38 -
 39
39 -
 40
40 -
 41
41 -
 42
42 -
 43
43 -
 44
44 -
 45
45 -
 46
46 -
 47
47 -
 48
48 -
 49
49 -
 50
50 -
 51
51 -
 52
52 -
 53
53 -
 54
54 -
 55
55 -
 56
56 -
 57
57 -
58
-
59
-
60
-
61
-
62
-
63
-
64
-
65
-
66
-
67
-
68
-
69
-
70
-
71
-
72
-
73
-
74
-
75
-
76
-
77
-
78
-
79
-
80
-
81
-
82
-
83
-
84
-
85
-
86
-
87
-
88
-
89
-
90
-
91
-
92
-
93
-
94
-
95
-
96
-
97
-
98
-
99
-
100
-
101
-
102
-
103
-
104
 |
 |
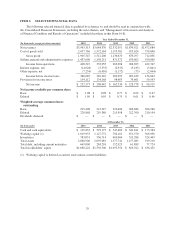
items which increased $57.5 million and an increase in net income of $45.7 million, partially offset by decreased
net cash flows from operating assets and liabilities of $4.3 million year over year. The decrease in net cash flows
related to changes in operating assets and liabilities period over period was primarily driven by the following:
• a decrease in inventory investments of $72.2 million due primarily to early deliveries of product and
incremental inventory investments in the prior year
• a larger increase in accounts receivable of $65.1 million in 2014 as compared to 2013, primarily due to
a higher proportion of sales to our international customers with longer payment terms compared to the
prior year.
Adjustments to net income for non-cash items increased in 2014 as compared to 2013 primarily due to an
increase in stock-based compensation and higher depreciation and amortization in 2014 as compared to 2013.
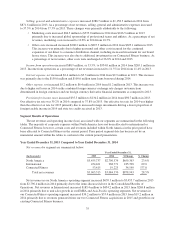
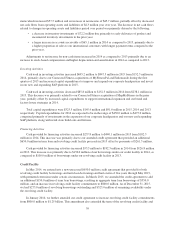
Investing Activities
Cash used in investing activities increased $695.2 million to $847.5 million in 2015 from $152.3 million in
2014, primarily due to our Connected Fitness acquisitions of MyFitnessPal and Endomondo during the first
quarter of 2015 and increased capital expenditures to improve and expand our corporate headquarters and invest
in our new and expanding SAP platform in 2015.
Cash used in investing activities decreased $85.8 million to $152.3 million in 2014 from $238.1 million in
2013. This decrease was primarily related to our Connected Fitness acquisition of MapMyFitness in the prior
year, partially offset by increased capital expenditures to support international expansion and our brand and
factory house strategies in 2014.
Total capital expenditures were $325.5 million, $145.4 million and $91.6 million in 2015, 2014 and 2013,
respectively. Capital expenditures for 2016 are expected to be in the range of $450.0 million to $475.0 million,
comprised primarily of investments in the expansion of our corporate headquarters and our new and expanding
SAP platform, along with retail store build outs and fixtures.
Financing Activities
Cash provided by financing activities increased $257.8 million to $440.1 million in 2015 from $182.3
million in 2014. This increase was primarily due to our amended credit agreement that provided an additional
$650.0 million in term loan and revolving credit facility proceeds in 2015 offset by payments of $261.3 million.
Cash provided by financing activities increased $55.5 million to $182.3 million in 2014 from $126.8 million
in 2013. This increase was primarily due to $150.0 million of net borrowings under our credit facility in 2014, as
compared to $100.0 million of borrowings under our revolving credit facility in 2013.
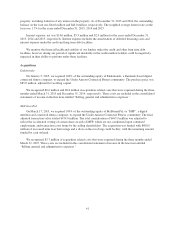
Credit Facility
In May 2014, we entered into a new unsecured $650.0 million credit agreement that provided for both
revolving credit facility borrowings and term loan borrowings and had a term of five years through May 2019,
with permitted extensions under certain circumstances. In March 2015, we amended the credit agreement to add
an additional $150.0 million of term loan borrowings, resulting in aggregate term loan borrowings of $350.0
million, and an increase in revolving credit facility commitments to $800.0 million. As of December 31, 2015,
we had $275.0 million of revolving borrowings outstanding and $525.0 million of remaining availability under
the revolving credit facility.
In January 2016, we further amended our credit agreement to increase revolving credit facility commitments
from $800.0 million to $1.25 billion. This amendment also extended the term of the revolving credit facility and
39