Under Armour 2015 Annual Report Download - page 60
Download and view the complete annual report
Please find page 60 of the 2015 Under Armour annual report below. You can navigate through the pages in the report by either clicking on the pages listed below, or by using the keyword search tool below to find specific information within the annual report.-
 1
1 -
2
-
3
-
4
-
5
-
6
-
7
-
8
-
9
-
10
-
11
-
12
-
13
-
14
-
15
-
16
-
17
-
18
-
19
-
20
-
21
-
22
-
23
-
24
-
25
-
26
-
27
-
28
-
29
-
30
-
31
-
32
-
33
-
34
-
35
-
36
-
37
-
38
-
39
-
40
-
41
-
42
-
43
-
44
-
45
-
46
-
47
-
48
-
49
-
 50
50 -
 51
51 -
 52
52 -
 53
53 -
 54
54 -
 55
55 -
 56
56 -
 57
57 -
 58
58 -
 59
59 -
 60
60 -
 61
61 -
 62
62 -
 63
63 -
 64
64 -
 65
65 -
 66
66 -
 67
67 -
 68
68 -
 69
69 -
 70
70 -
71
-
72
-
73
-
74
-
75
-
76
-
77
-
78
-
79
-
80
-
81
-
82
-
83
-
84
-
85
-
86
-
87
-
88
-
89
-
90
-
91
-
92
-
93
-
94
-
95
-
96
-
97
-
98
-
99
-
100
-
101
-
102
-
103
-
104
 |
 |
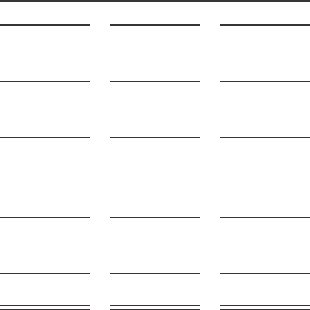
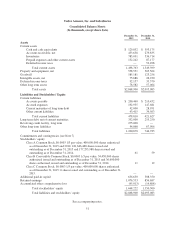
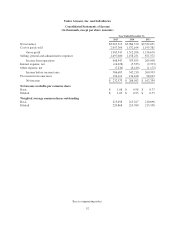
Under Armour, Inc. and Subsidiaries
Consolidated Statements of Income
(In thousands, except per share amounts)
Year Ended December 31,
2015 2014 2013
Net revenues $3,963,313 $3,084,370 $2,332,051
Cost of goods sold 2,057,766 1,572,164 1,195,381
Gross profit 1,905,547 1,512,206 1,136,670
Selling, general and administrative expenses 1,497,000 1,158,251 871,572
Income from operations 408,547 353,955 265,098
Interest expense, net (14,628) (5,335) (2,933)
Other expense, net (7,234) (6,410) (1,172)
Income before income taxes 386,685 342,210 260,993
Provision for income taxes 154,112 134,168 98,663
Net income $ 232,573 $ 208,042 $ 162,330
Net income available per common share
Basic $ 1.08 $ 0.98 $ 0.77
Diluted $ 1.05 $ 0.95 $ 0.75
Weighted average common shares outstanding
Basic 215,498 213,227 210,696
Diluted 220,868 219,380 215,958
See accompanying notes.
52