Under Armour 2015 Annual Report Download - page 44
Download and view the complete annual report
Please find page 44 of the 2015 Under Armour annual report below. You can navigate through the pages in the report by either clicking on the pages listed below, or by using the keyword search tool below to find specific information within the annual report.-
 1
1 -
2
-
3
-
4
-
5
-
6
-
7
-
8
-
9
-
10
-
11
-
12
-
13
-
14
-
15
-
16
-
17
-
18
-
19
-
20
-
21
-
22
-
23
-
24
-
25
-
26
-
27
-
28
-
29
-
30
-
31
-
32
-
33
-
 34
34 -
 35
35 -
 36
36 -
 37
37 -
 38
38 -
 39
39 -
 40
40 -
 41
41 -
 42
42 -
 43
43 -
 44
44 -
 45
45 -
 46
46 -
 47
47 -
 48
48 -
 49
49 -
 50
50 -
 51
51 -
 52
52 -
 53
53 -
 54
54 -
55
-
56
-
57
-
58
-
59
-
60
-
61
-
62
-
63
-
64
-
65
-
66
-
67
-
68
-
69
-
70
-
71
-
72
-
73
-
74
-
75
-
76
-
77
-
78
-
79
-
80
-
81
-
82
-
83
-
84
-
85
-
86
-
87
-
88
-
89
-
90
-
91
-
92
-
93
-
94
-
95
-
96
-
97
-
98
-
99
-
100
-
101
-
102
-
103
-
104
 |
 |

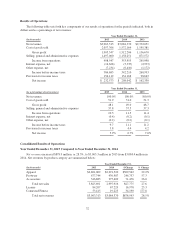
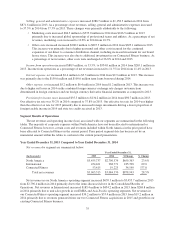
Operating income (loss) by segment is summarized below:
Year Ended December 31,
(In thousands) 2015 2014 $ Change % Change
North America $460,961 $379,814 $ 81,147 21.4%
International 8,887 (5,190) 14,077 271.2
Connected Fitness (61,301) (20,669) (40,632) (196.6)
Total operating income $408,547 $353,955 $ 54,592 15.4%
Operating income in our North America operating segment increased $81.2 million to $461.0 million in
2015 from $379.8 million in 2014 primarily due to the items discussed above in the Consolidated Results of
Operations. Operating income in international increased $14.1 million to $8.9 million in 2015 from an operating
loss of $5.2 million in 2014 primarily due to sales growth in our EMEA and Asia-Pacific operating segments.
Operating loss in our Connected Fitness segment increased $40.6 million to $61.3 million in 2015 from $20.7
million in 2014 primarily due to investments to support growth in our Connected Fitness business, including the
impact of our two Connected Fitness acquisitions in 2015. These acquisitions contributed $23.6 million to the
operating loss for the Connected Fitness segment in 2015.
Year Ended December 31, 2014 Compared to Year Ended December 31, 2013
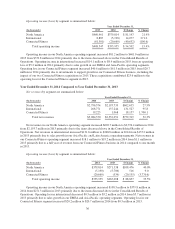
Net revenues by segment are summarized below:
Year Ended December 31,
(In thousands) 2014 2013 $ Change % Change
North America $2,796,374 $2,193,739 $602,635 27.5%
International 268,771 137,244 131,527 95.8
Connected Fitness 19,225 1,068 18,157 1,700.1
Total net revenues $3,084,370 $2,332,051 $752,319 32.3%
Net revenues in our North America operating segment increased $602.7 million to $2,796.4 million in 2014
from $2,193.7 million in 2013 primarily due to the items discussed above in the Consolidated Results of
Operations. Net revenues in international increased $131.6 million to $268.8 million in 2014 from $137.2 million
in 2013 primarily due to sales growth in our Asia-Pacific and Latin America operating segments. Net revenues in
our Connected Fitness operating segment increased $18.1 million to $19.2 million in 2014 from $1.1 million in
2013 primarily due to a full year of revenue from our Connected Fitness business in 2014 compared to one month
in 2013.
Operating income (loss) by segment is summarized below:
Year Ended December 31,
(In thousands) 2014 2013 $ Change % Change
North America $379,814 $271,338 $108,476 40.0%
International (5,190) (5,706) 516 9.0
Connected Fitness (20,669) (534) (20,135) (3,770.6)
Total operating income $353,955 $265,098 $ 88,857 33.5%
Operating income in our North America operating segment increased $108.5 million to $379.8 million in
2014 from $271.3 million in 2013 primarily due to the items discussed above in the Consolidated Results of
Operations. Operating loss in international decreased $0.5 million to $5.2 million in 2014 from $5.7 million in
2013 primarily due to sales growth in our EMEA and Asia-Pacific operating segments. Operating loss in our
Connected Fitness segment increased $20.2 million to $20.7 million in 2014 from $0.5 million in 2013.
36