Under Armour 2015 Annual Report Download - page 46
Download and view the complete annual report
Please find page 46 of the 2015 Under Armour annual report below. You can navigate through the pages in the report by either clicking on the pages listed below, or by using the keyword search tool below to find specific information within the annual report.-
 1
1 -
2
-
3
-
4
-
5
-
6
-
7
-
8
-
9
-
10
-
11
-
12
-
13
-
14
-
15
-
16
-
17
-
18
-
19
-
20
-
21
-
22
-
23
-
24
-
25
-
26
-
27
-
28
-
29
-
30
-
31
-
32
-
33
-
34
-
35
-
 36
36 -
 37
37 -
 38
38 -
 39
39 -
 40
40 -
 41
41 -
 42
42 -
 43
43 -
 44
44 -
 45
45 -
 46
46 -
 47
47 -
 48
48 -
 49
49 -
 50
50 -
 51
51 -
 52
52 -
 53
53 -
 54
54 -
 55
55 -
 56
56 -
57
-
58
-
59
-
60
-
61
-
62
-
63
-
64
-
65
-
66
-
67
-
68
-
69
-
70
-
71
-
72
-
73
-
74
-
75
-
76
-
77
-
78
-
79
-
80
-
81
-
82
-
83
-
84
-
85
-
86
-
87
-
88
-
89
-
90
-
91
-
92
-
93
-
94
-
95
-
96
-
97
-
98
-
99
-
100
-
101
-
102
-
103
-
104
 |
 |

At December 31, 2015, $48.5 million, or approximately 37.4%, of our cash was held by our foreign
subsidiaries where a repatriation of those funds to the United States would likely result in an additional tax
expense. However, based on the capital and liquidity needs of our foreign operations, as well as the status of
current tax law, we intend to indefinitely reinvest these funds outside the United States. In addition, our United
States operations do not require the repatriation of these funds to meet our currently projected liquidity needs.
Should we require additional capital in the United States, we may elect to repatriate indefinitely reinvested
foreign funds or raise capital in the United States. If we were to repatriate indefinitely reinvested foreign funds,
we would be required to accrue and pay additional U.S. taxes less applicable foreign tax credits. Determining the
tax liability that would arise if these earnings were repatriated is not practical.
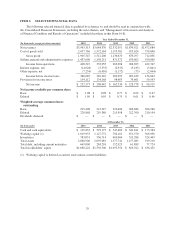
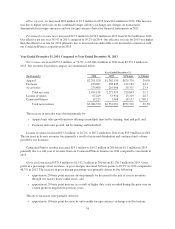
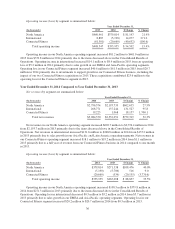
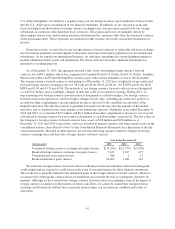
Cash Flows
The following table presents the major components of net cash flows used in and provided by operating,
investing and financing activities for the periods presented:
Year Ended December 31,
(In thousands) 2015 2014 2013
Net cash provided by (used in):
Operating activities $ (44,104) $ 219,033 $ 120,070
Investing activities (847,475) (152,312) (238,102)
Financing activities 440,078 182,306 126,795
Effect of exchange rate changes on cash and cash
equivalents (11,822) (3,341) (3,115)
Net increase in cash and cash equivalents $(463,323) $ 245,686 $ 5,648
Operating Activities
Operating activities consist primarily of net income adjusted for certain non-cash items. Adjustments to net
income for non-cash items include depreciation and amortization, unrealized foreign currency exchange rate
gains and losses, losses on disposals of property and equipment, stock-based compensation, deferred income
taxes and changes in reserves and allowances. In addition, operating cash flows include the effect of changes in
operating assets and liabilities, principally inventories, accounts receivable, income taxes payable and receivable,
prepaid expenses and other assets, accounts payable and accrued expenses.
Cash flows used in operating activities decreased $263.1 million to $44.1 million in 2015 from $219.0
million of cash provided by operating activities in 2014. The decrease in cash from operating activities was due
to decreased net cash flows from operating assets and liabilities of $370.1 million, partially offset by adjustments
to net income for non-cash items, which increased $82.5 million, and an increase in net income of $24.5 million
year over year. The decrease in cash outflows related to changes in operating assets and liabilities period over
period was primarily driven by the following:
• an increase in inventory investments of $193.9 million primarily due to early deliveries of product to
meet key seasonal floor set dates, as well as strategic investments in auto-replenishment products.
• a larger increase in accounts receivable of $90.8 million in 2015 as compared to 2014, primarily due to
the timing of shipments.
Adjustments to net income for non-cash items increased in 2015 as compared to 2014 primarily due to
higher depreciation and amortization expense in 2015 as compared to 2014 related to the expansion of our
distribution and corporate facilities as well as our two Connected Fitness acquisitions.
Cash provided by operating activities increased $98.9 million to $219.0 million in 2014 from $120.1 million
in 2013. The increase in cash provided by operating activities was due to adjustments to net income for non-cash
38