Under Armour 2013 Annual Report Download - page 85
Download and view the complete annual report
Please find page 85 of the 2013 Under Armour annual report below. You can navigate through the pages in the report by either clicking on the pages listed below, or by using the keyword search tool below to find specific information within the annual report.-
 1
1 -
2
-
3
-
4
-
5
-
6
-
7
-
8
-
9
-
10
-
11
-
12
-
13
-
14
-
15
-
16
-
17
-
18
-
19
-
20
-
21
-
22
-
23
-
24
-
25
-
26
-
27
-
28
-
29
-
30
-
31
-
32
-
33
-
34
-
35
-
36
-
37
-
38
-
39
-
40
-
41
-
42
-
43
-
44
-
45
-
46
-
47
-
48
-
49
-
50
-
51
-
52
-
53
-
54
-
55
-
56
-
57
-
58
-
59
-
60
-
61
-
62
-
63
-
64
-
65
-
66
-
67
-
68
-
69
-
70
-
71
-
72
-
73
-
74
-
 75
75 -
 76
76 -
 77
77 -
 78
78 -
 79
79 -
 80
80 -
 81
81 -
 82
82 -
 83
83 -
 84
84 -
 85
85 -
 86
86 -
 87
87 -
 88
88 -
 89
89 -
 90
90 -
 91
91 -
 92
92 -
 93
93 -
 94
94 -
 95
95 -
96
-
97
-
98
-
99
-
100
 |
 |

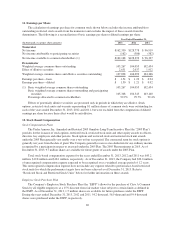
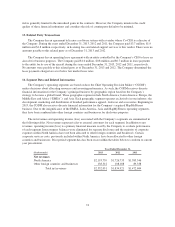
Year Ended December 31,
(In thousands) 2013 2012 2011
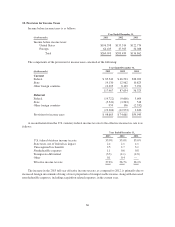
Operating income (loss)
North America $271,338 $200,084 $150,559
Other foreign countries and businesses (6,240) 8,611 12,208
Total operating income 265,098 208,695 162,767
Interest expense, net (2,933) (5,183) (3,841)
Other expense, net (1,172) (73) (2,064)
Income before income taxes $260,993 $203,439 $156,862
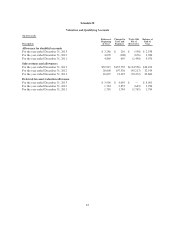
Net revenues by product category are as follows:
Year Ended December 31,
(In thousands) 2013 2012 2011
Apparel $1,762,150 $1,385,350 $1,122,031
Footwear 298,825 238,955 181,684
Accessories 216,098 165,835 132,400
Total net sales 2,277,073 1,790,140 1,436,115
Licensing and other revenues 54,978 44,781 36,569
Total net revenues $2,332,051 $1,834,921 $1,472,684
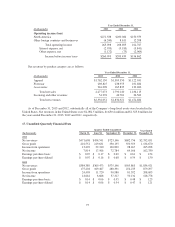
As of December 31, 2013 and 2012, substantially all of the Company’s long-lived assets were located in the
United States. Net revenues in the United States were $2,082.5 million, $1,650.4 million and $1,325.8 million for
the years ended December 31, 2013, 2012 and 2011, respectively.
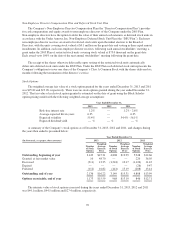
17. Unaudited Quarterly Financial Data
Quarter Ended (unaudited) Year Ended
December 31,(In thousands) March 31, June 30, September 30, December 31,
2013
Net revenues $471,608 $454,541 $723,146 $682,756 $2,332,051
Gross profit 216,551 219,631 350,135 350,353 1,136,670
Income from operations 13,492 32,310 120,829 98,467 265,098
Net income 7,814 17,566 72,784 64,166 162,330
Earnings per share-basic $ 0.07 $ 0.17 $ 0.69 $ 0.61 $ 1.54
Earnings per share-diluted $ 0.07 $ 0.16 $ 0.68 $ 0.59 $ 1.50
2012
Net revenues $384,389 $369,473 $575,196 $505,863 $1,834,921
Gross profit 175,204 169,467 280,391 254,235 879,297
Income from operations 24,403 11,720 90,980 81,592 208,695
Net income 14,661 6,668 57,317 50,132 128,778
Earnings per share-basic $ 0.14 $ 0.06 $ 0.55 $ 0.48 $ 1.23
Earnings per share-diluted $ 0.14 $ 0.06 $ 0.54 $ 0.47 $ 1.21
75