Under Armour 2013 Annual Report Download - page 47
Download and view the complete annual report
Please find page 47 of the 2013 Under Armour annual report below. You can navigate through the pages in the report by either clicking on the pages listed below, or by using the keyword search tool below to find specific information within the annual report.-
 1
1 -
2
-
3
-
4
-
5
-
6
-
7
-
8
-
9
-
10
-
11
-
12
-
13
-
14
-
15
-
16
-
17
-
18
-
19
-
20
-
21
-
22
-
23
-
24
-
25
-
26
-
27
-
28
-
29
-
30
-
31
-
32
-
33
-
34
-
35
-
36
-
 37
37 -
 38
38 -
 39
39 -
 40
40 -
 41
41 -
 42
42 -
 43
43 -
 44
44 -
 45
45 -
 46
46 -
 47
47 -
 48
48 -
 49
49 -
 50
50 -
 51
51 -
 52
52 -
 53
53 -
 54
54 -
 55
55 -
 56
56 -
 57
57 -
58
-
59
-
60
-
61
-
62
-
63
-
64
-
65
-
66
-
67
-
68
-
69
-
70
-
71
-
72
-
73
-
74
-
75
-
76
-
77
-
78
-
79
-
80
-
81
-
82
-
83
-
84
-
85
-
86
-
87
-
88
-
89
-
90
-
91
-
92
-
93
-
94
-
95
-
96
-
97
-
98
-
99
-
100
 |
 |

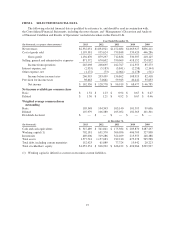
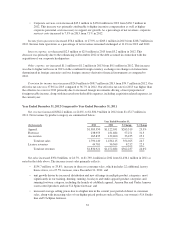
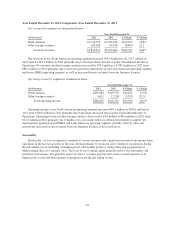
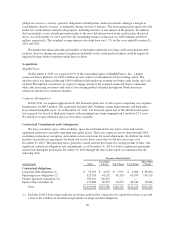
Cash Flows
The following table presents the major components of net cash flows used in and provided by operating,
investing and financing activities for the periods presented:
Year Ended December 31,
(In thousands) 2013 2012 2011
Net cash provided by (used in):
Operating activities $ 120,070 $199,761 $ 15,218
Investing activities (238,102) (46,931) (89,436)
Financing activities 126,795 12,297 45,807
Effect of exchange rate changes on cash and cash
equivalents (3,115) 1,330 (75)
Net increase (decrease) in cash and cash equivalents $ 5,648 $166,457 $(28,486)
Operating Activities
Operating activities consist primarily of net income adjusted for certain non-cash items. Adjustments to net
income for non-cash items include depreciation and amortization, unrealized foreign currency exchange rate
gains and losses, losses on disposals of property and equipment, stock-based compensation, deferred income
taxes and changes in reserves and allowances. In addition, operating cash flows include the effect of changes in
operating assets and liabilities, principally inventories, accounts receivable, income taxes payable and receivable,
prepaid expenses and other assets, accounts payable and accrued expenses.
Cash provided by operating activities decreased $79.7 million to $120.1 million in 2013 from $199.8
million in 2012. The decrease in cash provided by operating activities was due to decreased net cash flows from
operating assets and liabilities of $142.4 million, partially offset by an increase in net income of $33.6 million
and adjustments to net income for non-cash items, which increased $29.1 million year over year. The increase in
net cash flows related to changes in operating assets and liabilities period over period was primarily driven by the
following:
• an increase in inventory investments of $161.6 million. Inventory grew in 2013 at a rate higher than
revenue growth primarily due to supplier delivery challenges experienced in the prior year period, early
deliveries of product in the current period to manage supplier capacity and improve fill rates, along
with incremental inventory investments to support our growing international and direct to consumer
businesses.
This increase was also partially offset by:
• a larger increase in accrued expenses and other liabilities of $34.5 million in 2013 as compared to
2012, primarily due to higher accruals for our performance incentive plan as compared to the prior
period.
Adjustments to net income for non-cash items increased in 2013 as compared to 2012 primarily due to an
increase in stock-based compensation and higher depreciation and amortization in 2013 as compared to 2012.
Cash provided by operating activities increased $184.6 million to $199.8 million in 2012 from $15.2 million
in 2011. The increase in cash provided by operating activities was due to increased net cash flows from operating
assets and liabilities of $155.0 million and an increase in net income of $32.0 million, partially offset by
adjustments to net income for non-cash items which decreased $2.4 million year over year. The increase in net
cash flows related to changes in operating assets and liabilities period over period was primarily driven by the
following:
• a decrease in inventory investments of $119.3 million primarily driven by success around our inventory
management initiatives, along with delays in product receipts due to certain supplier challenges; and
37