Under Armour 2013 Annual Report Download - page 44
Download and view the complete annual report
Please find page 44 of the 2013 Under Armour annual report below. You can navigate through the pages in the report by either clicking on the pages listed below, or by using the keyword search tool below to find specific information within the annual report.-
 1
1 -
2
-
3
-
4
-
5
-
6
-
7
-
8
-
9
-
10
-
11
-
12
-
13
-
14
-
15
-
16
-
17
-
18
-
19
-
20
-
21
-
22
-
23
-
24
-
25
-
26
-
27
-
28
-
29
-
30
-
31
-
32
-
33
-
 34
34 -
 35
35 -
 36
36 -
 37
37 -
 38
38 -
 39
39 -
 40
40 -
 41
41 -
 42
42 -
 43
43 -
 44
44 -
 45
45 -
 46
46 -
 47
47 -
 48
48 -
 49
49 -
 50
50 -
 51
51 -
 52
52 -
 53
53 -
 54
54 -
55
-
56
-
57
-
58
-
59
-
60
-
61
-
62
-
63
-
64
-
65
-
66
-
67
-
68
-
69
-
70
-
71
-
72
-
73
-
74
-
75
-
76
-
77
-
78
-
79
-
80
-
81
-
82
-
83
-
84
-
85
-
86
-
87
-
88
-
89
-
90
-
91
-
92
-
93
-
94
-
95
-
96
-
97
-
98
-
99
-
100
 |
 |

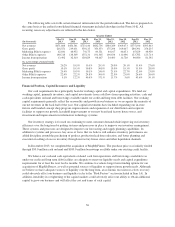
Other expense, net decreased $2.0 million to $0.1 million in 2012 from $2.1 million in 2011. This decrease
was due to lower net losses in 2012 on the combined foreign currency exchange rate changes on transactions
denominated in foreign currencies and our foreign currency derivative financial instruments as compared to
2011.
Provision for income taxes increased $14.8 million to $74.7 million in 2012 from $59.9 million in 2011. Our
effective tax rate was 36.7% in 2012 compared to 38.2% in 2011, primarily due to state tax credits received in
2012.
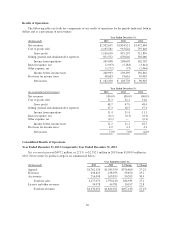
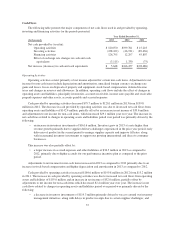
Segment Results of Operations
The net revenues and operating income (loss) associated with our segments are summarized in the following
tables. The majority of corporate expenses within North America have not been allocated to other foreign
countries and businesses. Certain corporate services costs, previously included within North America, have been
allocated to other foreign countries and businesses. Prior period segment data has been recast within the tables to
conform to current year presentation.
Year Ended December 31, 2013 Compared to Year Ended December 31, 2012
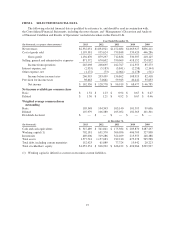
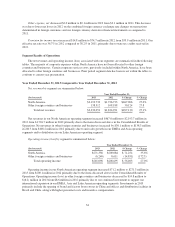
Net revenues by segment are summarized below:
Year Ended December 31,
(In thousands) 2013 2012 $ Change % Change
North America $2,193,739 $1,726,733 $467,006 27.0%
Other foreign countries and businesses 138,312 108,188 30,124 27.8
Total net revenues $2,332,051 $1,834,921 $497,130 27.1%
Net revenues in our North American operating segment increased $467.0 million to $2,193.7 million in
2013 from $1,726.7 million in 2012 primarily due to the items discussed above in the Consolidated Results of
Operations. Net revenues in other foreign countries and businesses increased by $30.1 million to $138.3 million
in 2013 from $108.2 million in 2012 primarily due to unit sales growth in our EMEA and Asia operating
segments and to distributors in our Latin American operating segment.
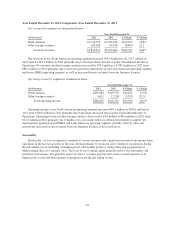
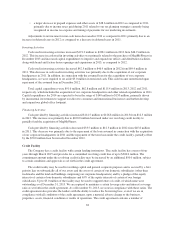
Operating income (loss) by segment is summarized below:
Year Ended December 31,
(In thousands) 2013 2012 $ Change % Change
North America $271,338 $200,084 $ 71,254 35.6%
Other foreign countries and businesses (6,240) 8,611 (14,851) (172.5)
Total operating income $265,098 $208,695 $ 56,403 27.0%
Operating income in our North American operating segment increased $71.2 million to $271.3 million in
2013 from $200.1 million in 2012 primarily due to the items discussed above in the Consolidated Results of
Operations. Operating income (loss) in other foreign countries and businesses decreased by $14.8 million to
$(6.2) million in 2013 from $8.6 million in 2012 primarily due to our continued investment to support our
international expansion in our EMEA, Asia and Latin American operating segments. Investments in 2013
primarily include the opening of brand and factory house stores in China and offices and distribution facilities in
Brazil and Chile, along with higher personnel costs and incentive compensation.
34