Under Armour 2013 Annual Report Download - page 76
Download and view the complete annual report
Please find page 76 of the 2013 Under Armour annual report below. You can navigate through the pages in the report by either clicking on the pages listed below, or by using the keyword search tool below to find specific information within the annual report.-
 1
1 -
2
-
3
-
4
-
5
-
6
-
7
-
8
-
9
-
10
-
11
-
12
-
13
-
14
-
15
-
16
-
17
-
18
-
19
-
20
-
21
-
22
-
23
-
24
-
25
-
26
-
27
-
28
-
29
-
30
-
31
-
32
-
33
-
34
-
35
-
36
-
37
-
38
-
39
-
40
-
41
-
42
-
43
-
44
-
45
-
46
-
47
-
48
-
49
-
50
-
51
-
52
-
53
-
54
-
55
-
56
-
57
-
58
-
59
-
60
-
61
-
62
-
63
-
64
-
65
-
 66
66 -
 67
67 -
 68
68 -
 69
69 -
 70
70 -
 71
71 -
 72
72 -
 73
73 -
 74
74 -
 75
75 -
 76
76 -
 77
77 -
 78
78 -
 79
79 -
 80
80 -
 81
81 -
 82
82 -
 83
83 -
 84
84 -
 85
85 -
 86
86 -
87
-
88
-
89
-
90
-
91
-
92
-
93
-
94
-
95
-
96
-
97
-
98
-
99
-
100
 |
 |

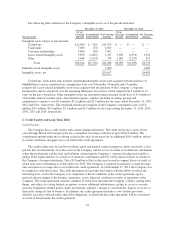
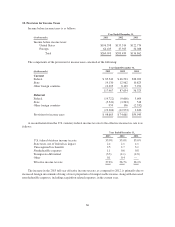
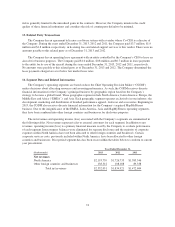
10. Provision for Income Taxes
Income before income taxes is as follows:
Year Ended December 31,
(In thousands) 2013 2012 2011
Income before income taxes:
United States $196,558 $155,514 $122,774
Foreign 64,435 47,925 34,088
Total $260,993 $203,439 $156,862
The components of the provision for income taxes consisted of the following:
Year Ended December 31,
(In thousands) 2013 2012 2011
Current
Federal $ 85,542 $ 66,533 $38,209
State 19,130 12,962 10,823
Other foreign countries 13,295 8,139 7,291
117,967 87,634 56,323
Deferred
Federal (14,722) (9,606) 5,604
State (5,541) (3,563) 548
Other foreign countries 959 196 (2,532)
(19,304) (12,973) 3,620
Provision for income taxes $ 98,663 $ 74,661 $59,943
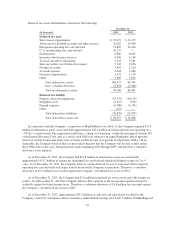
A reconciliation from the U.S. statutory federal income tax rate to the effective income tax rate is as
follows:
Year Ended December 31,
2013 2012 2011
U.S. federal statutory income tax rate 35.0% 35.0% 35.0%
State taxes, net of federal tax impact 2.4 2.1 4.1
Unrecognized tax benefits 2.5 2.7 3.1
Nondeductible expenses 1.1 0.6 0.8
Foreign rate differential (3.3) (4.1) (4.8)
Other 0.1 0.4 —
Effective income tax rate 37.8% 36.7% 38.2%
The increase in the 2013 full year effective income tax rate, as compared to 2012, is primarily due to
increased foreign investments driving a lower proportion of foreign taxable income, along with increased
non-deductible expenses, including acquisition related expenses, in the current year.
66