Under Armour 2013 Annual Report Download - page 43
Download and view the complete annual report
Please find page 43 of the 2013 Under Armour annual report below. You can navigate through the pages in the report by either clicking on the pages listed below, or by using the keyword search tool below to find specific information within the annual report.-
 1
1 -
2
-
3
-
4
-
5
-
6
-
7
-
8
-
9
-
10
-
11
-
12
-
13
-
14
-
15
-
16
-
17
-
18
-
19
-
20
-
21
-
22
-
23
-
24
-
25
-
26
-
27
-
28
-
29
-
30
-
31
-
32
-
 33
33 -
 34
34 -
 35
35 -
 36
36 -
 37
37 -
 38
38 -
 39
39 -
 40
40 -
 41
41 -
 42
42 -
 43
43 -
 44
44 -
 45
45 -
 46
46 -
 47
47 -
 48
48 -
 49
49 -
 50
50 -
 51
51 -
 52
52 -
 53
53 -
54
-
55
-
56
-
57
-
58
-
59
-
60
-
61
-
62
-
63
-
64
-
65
-
66
-
67
-
68
-
69
-
70
-
71
-
72
-
73
-
74
-
75
-
76
-
77
-
78
-
79
-
80
-
81
-
82
-
83
-
84
-
85
-
86
-
87
-
88
-
89
-
90
-
91
-
92
-
93
-
94
-
95
-
96
-
97
-
98
-
99
-
100
 |
 |
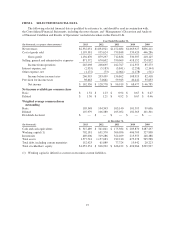
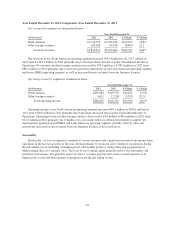
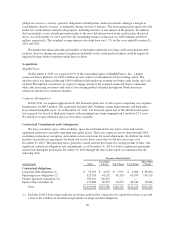
License revenues increased $8.2 million, or 22.5%, to $44.8 million in 2012 from $36.6 million in 2011.
This increase in license revenues was a result of increased distribution and continued unit volume growth by our
licensees.
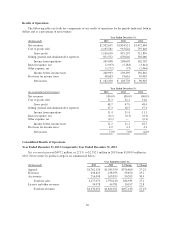
Gross profit increased $166.5 million to $879.3 million in 2012 from $712.8 million in 2011. Gross profit as
a percentage of net revenues, or gross margin, decreased 50 basis points to 47.9% in 2012 compared
to 48.4% in 2011. The decrease in gross margin percentage was primarily driven by the following:
• approximate 35 basis point decrease driven by sales mix. The sales mix impact was partially driven by
increased sales of excess inventory through our factory house stores at lower prices, along with a larger
proportion of footwear sales, primarily due to new 2012 running styles and growth within our cleated
shoe sales; and
• approximate 25 basis point decrease driven by higher inbound freight, partially due to supply chain
challenges, required to meet customer demand.
The above decreases were partially offset by the below increase:
• approximate 20 basis point increase driven primarily by lower North American apparel product input
costs, partially offset by higher North American accessories and footwear input costs.
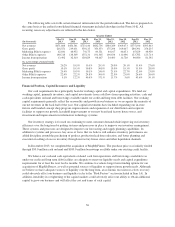
Selling, general and administrative expenses increased $120.5 million to $670.6 million in 2012 from
$550.1 million in 2011. As a percentage of net revenues, selling, general and administrative expenses decreased
to 36.5% in 2012 from 37.3% in 2011. These changes were primarily attributable to the following:
• Marketing costs increased $37.5 million to $205.4 million in 2012 from $167.9 million in 2011
primarily due to increased marketing campaigns for key apparel and footwear launches in 2012 and
sponsorship of collegiate and professional teams and athletes, including Tottenham Hotspur Football
Club. As a percentage of net revenues, marketing costs decreased slightly to 11.2% in 2012 from
11.4% in 2011.
• Selling costs increased $37.2 million to $176.0 million in 2012 from $138.8 million in 2011. This
increase was primarily due to higher personnel and other costs incurred primarily for the continued
expansion of our direct to consumer distribution channel. As a percentage of net revenues, selling costs
increased slightly to 9.6% in 2012 from 9.4% in 2011.
• Product innovation and supply chain costs increased $29.4 million to $158.5 million in 2012 from
$129.1 million in 2011 primarily due to higher distribution facilities operating and personnel costs to
support our growth in net revenues and higher personnel costs for the design and sourcing of our
expanding apparel, footwear and accessory lines. As a percentage of net revenues, product innovation
and supply chain costs decreased slightly to 8.6% in 2012 from 8.8% in 2011.
• Corporate services costs increased $16.4 million to $130.7 million in 2012 from $114.3 million
in 2011. This increase was primarily attributable to higher corporate personnel cost and information
technology initiatives necessary to support our growth. As a percentage of net revenues, corporate
services costs decreased to 7.1% in 2012 from 7.7% in 2011 primarily due to decreased corporate
personnel costs as a percentage of net revenues in 2012.
Income from operations increased $45.9 million, or 28.2%, to $208.7 million in 2012 from $162.8 million in
2011. Income from operations as a percentage of net revenues increased to 11.4% in 2012 from 11.1% in 2011.
This increase was a result of the items discussed above.
Interest expense, net increased $1.4 million to $5.2 million in 2012 from $3.8 million in 2011. This increase
was primarily due to a full year of interest on the debt related to the acquisition of our corporate headquarters in
2012 as compared to 2011.
33