Under Armour 2013 Annual Report Download - page 41
Download and view the complete annual report
Please find page 41 of the 2013 Under Armour annual report below. You can navigate through the pages in the report by either clicking on the pages listed below, or by using the keyword search tool below to find specific information within the annual report.-
 1
1 -
2
-
3
-
4
-
5
-
6
-
7
-
8
-
9
-
10
-
11
-
12
-
13
-
14
-
15
-
16
-
17
-
18
-
19
-
20
-
21
-
22
-
23
-
24
-
25
-
26
-
27
-
28
-
29
-
30
-
 31
31 -
 32
32 -
 33
33 -
 34
34 -
 35
35 -
 36
36 -
 37
37 -
 38
38 -
 39
39 -
 40
40 -
 41
41 -
 42
42 -
 43
43 -
 44
44 -
 45
45 -
 46
46 -
 47
47 -
 48
48 -
 49
49 -
 50
50 -
 51
51 -
52
-
53
-
54
-
55
-
56
-
57
-
58
-
59
-
60
-
61
-
62
-
63
-
64
-
65
-
66
-
67
-
68
-
69
-
70
-
71
-
72
-
73
-
74
-
75
-
76
-
77
-
78
-
79
-
80
-
81
-
82
-
83
-
84
-
85
-
86
-
87
-
88
-
89
-
90
-
91
-
92
-
93
-
94
-
95
-
96
-
97
-
98
-
99
-
100
 |
 |
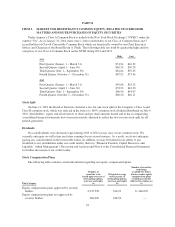
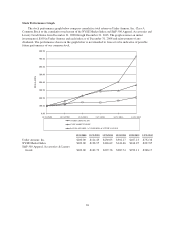
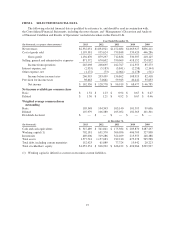
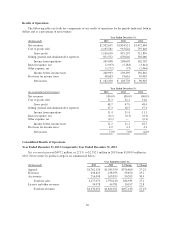
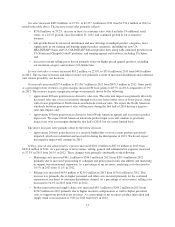
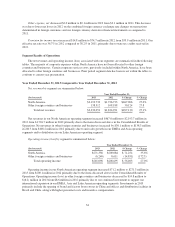
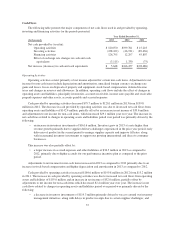
Net sales increased $487.0 million, or 27.2%, to $2,277.1 million in 2013 from $1,790.1 million in 2012 as
noted in the table above. The increase in net sales primarily reflects:
• $176.8 million, or 33.2%, increase in direct to consumer sales, which includes 18 additional retail
stores, or a 16.5% growth, since December 31, 2012, and continued growth in our ecommerce
business;
• unit growth driven by increased distribution and new offerings in multiple product categories, most
significantly in our training and hunting apparel product categories, including our new UA
HEATGEAR®Sonic and UA COLDGEAR®Infrared product lines along with continued growth in our
UA Storm and Charged Cotton®platforms, and running apparel and footwear, including UA Spine;
and
• increased average selling prices driven primarily from our higher priced apparel products, including
our mountain category and women’s UA Studio line.
License and other revenues increased $10.2 million, or 22.8%, to $55.0 million in 2013 from $44.8 million
in 2012. This increase in license and other revenues was primarily a result of increased distribution and continued
unit volume growth by our licensees.
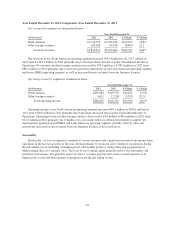
Gross profit increased $257.4 million to $1,136.7 million in 2013 from $879.3 million in 2012. Gross profit
as a percentage of net revenues, or gross margin, increased 80 basis points to 48.7% in 2013 compared to 47.9%
in 2012. The increase in gross margin percentage was primarily driven by the following:
• approximate 60 basis point increase driven by sales mix. The sales mix impact was primarily driven by
decreased sales mix of excess inventory through our factory house outlet stores at lower prices, along
with a lower proportion of North American wholesale footwear sales. We expect the North American
wholesale footwear proportion of sales will increase during the first half of 2014 driving a negative
sales mix impact; and
• approximate 50 basis point increase driven by lower North American apparel and accessories product
input costs. We expect North American wholesale product input costs will continue to positively
impact year over year margins during the first half of 2014, but on a more limited basis.
The above increases were partially offset by the below decrease:
• approximate 20 basis point decrease as a result of higher duty costs on certain products previously
imported, which were identified and reserved for during the third quarter of 2013. We do not expect
this negative impact will continue in 2014.
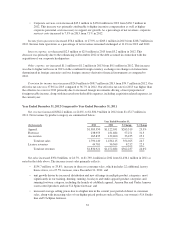
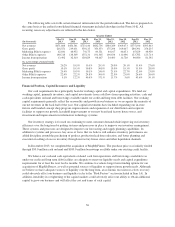
Selling, general and administrative expenses increased $201.0 million to $871.6 million in 2013 from
$670.6 million in 2012. As a percentage of net revenues, selling, general and administrative expenses increased
to 37.3% in 2013 from 36.5% in 2012. These changes were primarily attributable to the following:
• Marketing costs increased $41.1 million to $246.5 million in 2013 from $205.4 million in 2012
primarily due to increased sponsorship of collegiate and professional teams and athletes and marketing
to support our international expansion. As a percentage of net revenues, marketing costs decreased to
10.5% in 2013 from 11.2% in 2012.
• Selling costs increased $63.9 million to $239.9 million in 2013 from $176.0 million in 2012. This
increase was primarily due to higher personnel and other costs incurred primarily for the continued
expansion of our direct to consumer distribution channel. As a percentage of net revenues, selling costs
increased to 10.3% in 2013 from 9.6% in 2012.
• Product innovation and supply chain costs increased $50.7 million to $209.2 million in 2013 from
$158.5 million in 2012 primarily due to higher incentive compensation as well as higher personnel
costs to support our growth in net revenues. As a percentage of net revenues, product innovation and
supply chain costs increased to 9.0% in 2013 from 8.6% in 2012.
31