Under Armour 2013 Annual Report Download - page 40
Download and view the complete annual report
Please find page 40 of the 2013 Under Armour annual report below. You can navigate through the pages in the report by either clicking on the pages listed below, or by using the keyword search tool below to find specific information within the annual report.-
 1
1 -
2
-
3
-
4
-
5
-
6
-
7
-
8
-
9
-
10
-
11
-
12
-
13
-
14
-
15
-
16
-
17
-
18
-
19
-
20
-
21
-
22
-
23
-
24
-
25
-
26
-
27
-
28
-
29
-
 30
30 -
 31
31 -
 32
32 -
 33
33 -
 34
34 -
 35
35 -
 36
36 -
 37
37 -
 38
38 -
 39
39 -
 40
40 -
 41
41 -
 42
42 -
 43
43 -
 44
44 -
 45
45 -
 46
46 -
 47
47 -
 48
48 -
 49
49 -
 50
50 -
51
-
52
-
53
-
54
-
55
-
56
-
57
-
58
-
59
-
60
-
61
-
62
-
63
-
64
-
65
-
66
-
67
-
68
-
69
-
70
-
71
-
72
-
73
-
74
-
75
-
76
-
77
-
78
-
79
-
80
-
81
-
82
-
83
-
84
-
85
-
86
-
87
-
88
-
89
-
90
-
91
-
92
-
93
-
94
-
95
-
96
-
97
-
98
-
99
-
100
 |
 |

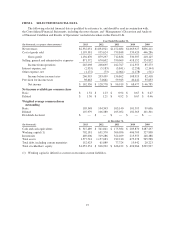
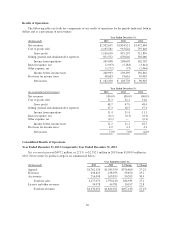
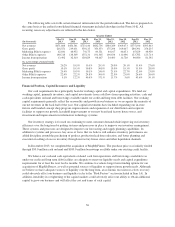
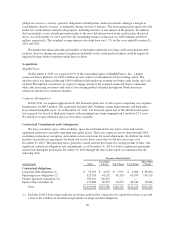
Results of Operations
The following table sets forth key components of our results of operations for the periods indicated, both in
dollars and as a percentage of net revenues:
Year Ended December 31,
(In thousands) 2013 2012 2011
Net revenues $2,332,051 $1,834,921 $1,472,684
Cost of goods sold 1,195,381 955,624 759,848
Gross profit 1,136,670 879,297 712,836
Selling, general and administrative expenses 871,572 670,602 550,069
Income from operations 265,098 208,695 162,767
Interest expense, net (2,933) (5,183) (3,841)
Other expense, net (1,172) (73) (2,064)
Income before income taxes 260,993 203,439 156,862
Provision for income taxes 98,663 74,661 59,943
Net income $ 162,330 $ 128,778 $ 96,919
Year Ended December 31,
(As a percentage of net revenues) 2013 2012 2011
Net revenues 100.0% 100.0% 100.0%
Cost of goods sold 51.3 52.1 51.6
Gross profit 48.7 47.9 48.4
Selling, general and administrative expenses 37.3 36.5 37.3
Income from operations 11.4 11.4 11.1
Interest expense, net (0.1) (0.3) (0.3)
Other expense, net (0.1) — (0.1)
Income before income taxes 11.2 11.1 10.7
Provision for income taxes 4.2 4.1 4.1
Net income 7.0% 7.0% 6.6%
Consolidated Results of Operations
Year Ended December 31, 2013 Compared to Year Ended December 31, 2012
Net revenues increased $497.2 million, or 27.1%, to $2,332.1 million in 2013 from $1,834.9 million in
2012. Net revenues by product category are summarized below:
Year Ended December 31,
(In thousands) 2013 2012 $ Change % Change
Apparel $1,762,150 $1,385,350 $376,800 27.2%
Footwear 298,825 238,955 59,870 25.1
Accessories 216,098 165,835 50,263 30.3
Total net sales 2,277,073 1,790,140 486,933 27.2
License and other revenues 54,978 44,781 10,197 22.8
Total net revenues $2,332,051 $1,834,921 $497,130 27.1%
30