Under Armour 2013 Annual Report Download - page 61
Download and view the complete annual report
Please find page 61 of the 2013 Under Armour annual report below. You can navigate through the pages in the report by either clicking on the pages listed below, or by using the keyword search tool below to find specific information within the annual report.-
 1
1 -
2
-
3
-
4
-
5
-
6
-
7
-
8
-
9
-
10
-
11
-
12
-
13
-
14
-
15
-
16
-
17
-
18
-
19
-
20
-
21
-
22
-
23
-
24
-
25
-
26
-
27
-
28
-
29
-
30
-
31
-
32
-
33
-
34
-
35
-
36
-
37
-
38
-
39
-
40
-
41
-
42
-
43
-
44
-
45
-
46
-
47
-
48
-
49
-
50
-
 51
51 -
 52
52 -
 53
53 -
 54
54 -
 55
55 -
 56
56 -
 57
57 -
 58
58 -
 59
59 -
 60
60 -
 61
61 -
 62
62 -
 63
63 -
 64
64 -
 65
65 -
 66
66 -
 67
67 -
 68
68 -
 69
69 -
 70
70 -
 71
71 -
72
-
73
-
74
-
75
-
76
-
77
-
78
-
79
-
80
-
81
-
82
-
83
-
84
-
85
-
86
-
87
-
88
-
89
-
90
-
91
-
92
-
93
-
94
-
95
-
96
-
97
-
98
-
99
-
100
 |
 |

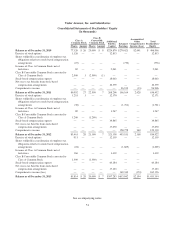
Under Armour, Inc. and Subsidiaries
Consolidated Statements of Stockholders’ Equity
(In thousands)
Class A
Common Stock
Class B
Convertible
Common Stock Additional
Paid-In
Capital
Retained
Earnings
Accumulated
Other
Comprehensive
Income (Loss)
Total
Stockholders’
EquityShares Amount Shares Amount
Balance as of December 31, 2010 77,320 $ 26 25,000 $ 8 $224,870 $270,021 $2,041 $ 496,966
Exercise of stock options 1,126 — — — 12,853 — — 12,853
Shares withheld in consideration of employee tax
obligations relative to stock-based compensation
arrangements (23) — — — — (776) — (776)
Issuance of Class A Common Stock, net of
forfeitures 69 — — — 2,041 — — 2,041
Class B Convertible Common Stock converted to
Class A Common Stock 2,500 1 (2,500) (1) — — — —
Stock-based compensation expense — — — — 18,063 — — 18,063
Net excess tax benefits from stock-based
compensation arrangements — — — — 10,379 — — 10,379
Comprehensive income — — — — — 96,919 (13) 96,906
Balance as of December 31, 2011 80,992 27 22,500 7 268,206 366,164 2,028 636,432
Exercise of stock options 1,218 1 — — 12,370 — — 12,371
Shares withheld in consideration of employee tax
obligations relative to stock-based compensation
arrangements (38) — — — — (1,761) — (1,761)
Issuance of Class A Common Stock, net of
forfeitures 89 — — — 3,247 — — 3,247
Class B Convertible Common Stock converted to
Class A Common Stock 1,200 — (1,200) — — — — —
Stock-based compensation expense — — — — 19,845 — — 19,845
Net excess tax benefits from stock-based
compensation arrangements — — — — 17,670 — — 17,670
Comprehensive income — — — — — 128,778 340 129,118
Balance as of December 31, 2012 83,461 28 21,300 7 321,338 493,181 2,368 816,922
Exercise of stock options 911 — — — 12,159 — — 12,159
Shares withheld in consideration of employee tax
obligations relative to stock-based compensation
arrangements (24) — — — — (1,669) — (1,669)
Issuance of Class A Common Stock, net of
forfeitures 166 — — — 3,439 — — 3,439
Class B Convertible Common Stock converted to
Class A Common Stock 1,300 — (1,300) — — — — —
Stock-based compensation expense — — — — 43,184 — — 43,184
Net excess tax benefits from stock-based
compensation arrangements — — — — 17,163 — — 17,163
Comprehensive income (loss) — — — — — 162,330 (174) 162,156
Balance as of December 31, 2013 85,814 $ 28 20,000 $ 7 $397,283 $653,842 $2,194 $1,053,354
See accompanying notes.
51