Under Armour 2013 Annual Report Download - page 62
Download and view the complete annual report
Please find page 62 of the 2013 Under Armour annual report below. You can navigate through the pages in the report by either clicking on the pages listed below, or by using the keyword search tool below to find specific information within the annual report.-
 1
1 -
2
-
3
-
4
-
5
-
6
-
7
-
8
-
9
-
10
-
11
-
12
-
13
-
14
-
15
-
16
-
17
-
18
-
19
-
20
-
21
-
22
-
23
-
24
-
25
-
26
-
27
-
28
-
29
-
30
-
31
-
32
-
33
-
34
-
35
-
36
-
37
-
38
-
39
-
40
-
41
-
42
-
43
-
44
-
45
-
46
-
47
-
48
-
49
-
50
-
51
-
 52
52 -
 53
53 -
 54
54 -
 55
55 -
 56
56 -
 57
57 -
 58
58 -
 59
59 -
 60
60 -
 61
61 -
 62
62 -
 63
63 -
 64
64 -
 65
65 -
 66
66 -
 67
67 -
 68
68 -
 69
69 -
 70
70 -
 71
71 -
 72
72 -
73
-
74
-
75
-
76
-
77
-
78
-
79
-
80
-
81
-
82
-
83
-
84
-
85
-
86
-
87
-
88
-
89
-
90
-
91
-
92
-
93
-
94
-
95
-
96
-
97
-
98
-
99
-
100
 |
 |

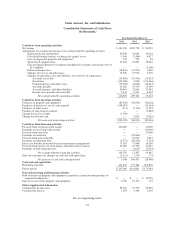
Under Armour, Inc. and Subsidiaries
Consolidated Statements of Cash Flows
(In thousands)
Year Ended December 31,
2013 2012 2011
Cash flows from operating activities
Net income $ 162,330 $128,778 $ 96,919
Adjustments to reconcile net income to net cash provided by operating activities
Depreciation and amortization 50,549 43,082 36,301
Unrealized foreign currency exchange rate (gains) losses 1,905 (2,464) 4,027
Loss on disposal of property and equipment 332 524 36
Stock-based compensation 43,184 19,845 18,063
Gain on bargain purchase of corporate headquarters (excludes transaction costs of
$1.9 million) — — (3,300)
Deferred income taxes (18,832) (12,973) 3,620
Changes in reserves and allowances 13,945 13,916 5,536
Changes in operating assets and liabilities, net of effects of acquisitions:
Accounts receivable (35,960) (53,433) (33,923)
Inventories (156,900) 4,699 (114,646)
Prepaid expenses and other assets (19,049) (4,060) (42,633)
Accounts payable 14,642 35,370 17,209
Accrued expenses and other liabilities 56,481 21,966 23,442
Income taxes payable and receivable 7,443 4,511 4,567
Net cash provided by operating activities 120,070 199,761 15,218
Cash flows from investing activities
Purchases of property and equipment (87,830) (50,650) (56,228)
Purchases of businesses, net of cash acquired (148,097) — (23,164)
Purchases of other assets (475) (1,310) (1,153)
Purchase of long term investment — — (3,862)
Change in loans receivable (1,700) — —
Change in restricted cash — 5,029 (5,029)
Net cash used in investing activities (238,102) (46,931) (89,436)
Cash flows from financing activities
Proceeds from revolving credit facility 100,000 — 30,000
Payments on revolving credit facility — — (30,000)
Proceeds from term loan — — 25,000
Payments on term loan — (25,000) —
Proceeds from long term debt — 50,000 5,644
Payments on long term debt (5,471) (44,330) (7,418)
Excess tax benefits from stock-based compensation arrangements 17,167 17,868 10,260
Proceeds from exercise of stock options and other stock issuances 15,099 14,776 14,645
Payments of debt financing costs — (1,017) (2,324)
Net cash provided by financing activities 126,795 12,297 45,807
Effect of exchange rate changes on cash and cash equivalents (3,115) 1,330 (75)
Net increase in cash and cash equivalents 5,648 166,457 (28,486)
Cash and cash equivalents
Beginning of period 341,841 175,384 203,870
End of period $ 347,489 $341,841 $ 175,384
Non-cash investing and financing activities
Debt assumed and property and equipment acquired in connection with purchase of
corporate headquarters $ — $ — $ 38,556
Increase in accrual for property and equipment 3,786 12,137 157
Other supplemental information
Cash paid for income taxes 85,570 57,739 56,940
Cash paid for interest 1,505 3,306 2,305
See accompanying notes.
52