Under Armour 2013 Annual Report Download - page 70
Download and view the complete annual report
Please find page 70 of the 2013 Under Armour annual report below. You can navigate through the pages in the report by either clicking on the pages listed below, or by using the keyword search tool below to find specific information within the annual report.-
 1
1 -
2
-
3
-
4
-
5
-
6
-
7
-
8
-
9
-
10
-
11
-
12
-
13
-
14
-
15
-
16
-
17
-
18
-
19
-
20
-
21
-
22
-
23
-
24
-
25
-
26
-
27
-
28
-
29
-
30
-
31
-
32
-
33
-
34
-
35
-
36
-
37
-
38
-
39
-
40
-
41
-
42
-
43
-
44
-
45
-
46
-
47
-
48
-
49
-
50
-
51
-
52
-
53
-
54
-
55
-
56
-
57
-
58
-
59
-
 60
60 -
 61
61 -
 62
62 -
 63
63 -
 64
64 -
 65
65 -
 66
66 -
 67
67 -
 68
68 -
 69
69 -
 70
70 -
 71
71 -
 72
72 -
 73
73 -
 74
74 -
 75
75 -
 76
76 -
 77
77 -
 78
78 -
 79
79 -
 80
80 -
81
-
82
-
83
-
84
-
85
-
86
-
87
-
88
-
89
-
90
-
91
-
92
-
93
-
94
-
95
-
96
-
97
-
98
-
99
-
100
 |
 |

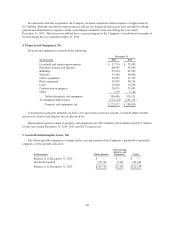
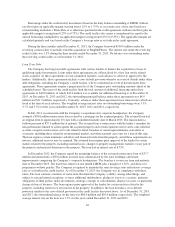
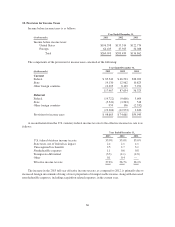
In connection with this acquisition, the Company incurred acquisition related expenses of approximately
$1.9 million. Both the acquisition related expenses and pre-tax bargain purchase gain were included in selling,
general and administrative expenses on the consolidated statements of income during the year ended
December 31, 2011. This transaction did not have a material impact to the Company’s consolidated statements of
income during the year ended December 31, 2013.
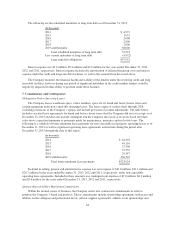
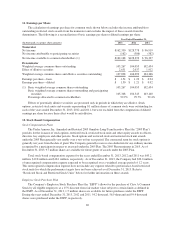
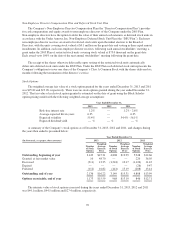
4. Property and Equipment, Net
Property and equipment consisted of the following:
December 31,
(In thousands) 2013 2012
Leasehold and tenant improvements $ 97,776 $ 75,058
Furniture, fixtures and displays 68,045 59,849
Buildings 45,903 42,533
Software 51,984 40,836
Office equipment 39,551 35,752
Plant equipment 45,509 30,214
Land 17,628 17,628
Construction in progress 28,471 23,005
Other 1,219 1,246
Subtotal property and equipment 396,086 326,121
Accumulated depreciation (172,134) (145,271)
Property and equipment, net $ 223,952 $ 180,850
Construction in progress primarily includes costs incurred for software systems, leasehold improvements
and in-store fixtures and displays not yet placed in use.
Depreciation expense related to property and equipment was $48.3 million, $39.8 million and $32.7 million
for the years ended December 31, 2013, 2012 and 2011, respectively.
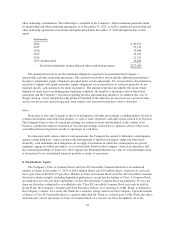
5. Goodwill and Intangible Assets, Net
The following table summarizes changes in the carrying amount of the Company’s goodwill by reportable
segment as of the periods indicated:
(In thousands) North America
Other foreign
countries and
businesses Total
Balance as of December 31, 2012 $ — $ — $ —
Goodwill acquired 119,799 2,445 122,244
Balance as of December 31, 2013 $119,799 $2,445 $122,244
60