Under Armour 2013 Annual Report Download - page 84
Download and view the complete annual report
Please find page 84 of the 2013 Under Armour annual report below. You can navigate through the pages in the report by either clicking on the pages listed below, or by using the keyword search tool below to find specific information within the annual report.-
 1
1 -
2
-
3
-
4
-
5
-
6
-
7
-
8
-
9
-
10
-
11
-
12
-
13
-
14
-
15
-
16
-
17
-
18
-
19
-
20
-
21
-
22
-
23
-
24
-
25
-
26
-
27
-
28
-
29
-
30
-
31
-
32
-
33
-
34
-
35
-
36
-
37
-
38
-
39
-
40
-
41
-
42
-
43
-
44
-
45
-
46
-
47
-
48
-
49
-
50
-
51
-
52
-
53
-
54
-
55
-
56
-
57
-
58
-
59
-
60
-
61
-
62
-
63
-
64
-
65
-
66
-
67
-
68
-
69
-
70
-
71
-
72
-
73
-
 74
74 -
 75
75 -
 76
76 -
 77
77 -
 78
78 -
 79
79 -
 80
80 -
 81
81 -
 82
82 -
 83
83 -
 84
84 -
 85
85 -
 86
86 -
 87
87 -
 88
88 -
 89
89 -
 90
90 -
 91
91 -
 92
92 -
 93
93 -
 94
94 -
95
-
96
-
97
-
98
-
99
-
100
 |
 |

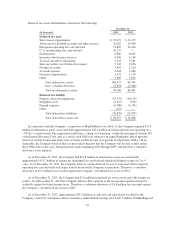
risk is generally limited to the unrealized gains in the contracts. However, the Company monitors the credit
quality of these financial institutions and considers the risk of counterparty default to be minimal.
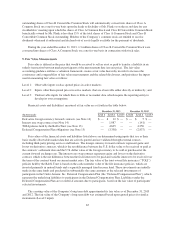
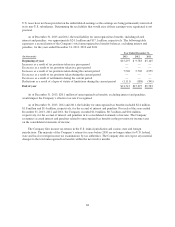
15. Related Party Transactions
The Company has an agreement to license a software system with a vendor whose Co-CEO is a director of
the Company. During the years ended December 31, 2013, 2012 and 2011, the Company paid $3.7 million, $1.9
million and $1.8 million, respectively, in licensing fees and related support services to this vendor. There were no
amounts payable to this related party as of December 31, 2013 and 2012.
The Company has an operating lease agreement with an entity controlled by the Company’s CEO to lease an
aircraft for business purposes. The Company paid $1.0 million, $0.8 million and $0.7 million in lease payments
to the entity for its use of the aircraft during the years ended December 31, 2013, 2012 and 2011, respectively.
No amounts were payable to this related party as of December 31, 2013 and 2012. The Company determined the
lease payments charged are at or below fair market lease rates.
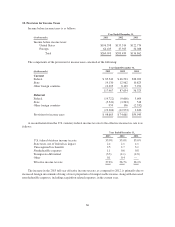
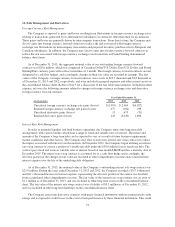
16. Segment Data and Related Information
The Company’s operating segments are based on how the Chief Operating Decision Maker (“CODM”)
makes decisions about allocating resources and assessing performance. As such, the CODM receives discrete
financial information for the Company’s principal business by geographic region based on the Company’s
strategy to become a global brand. These geographic regions include North America; Latin America; Europe, the
Middle East and Africa (“EMEA”); and Asia. Each geographic segment operates exclusively in one industry: the
development, marketing and distribution of branded performance apparel, footwear and accessories. Beginning in
2013, the CODM also receives discrete financial information for the Company’s acquired MapMyFitness
business. Due to the insignificance of the EMEA, Latin America, Asia and MapMyFitness operating segments,
they have been combined into other foreign countries and businesses for disclosure purposes.
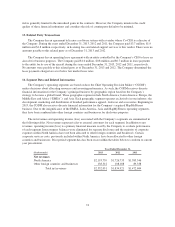
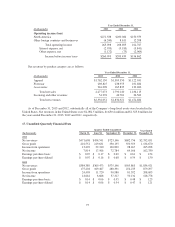
The net revenues and operating income (loss) associated with the Company’s segments are summarized in
the following tables. Net revenues represent sales to external customers for each segment. In addition to net
revenues, operating income (loss) is a primary financial measure used by the Company to evaluate performance
of each segment. Intercompany balances were eliminated for separate disclosure and the majority of corporate
expenses within North America have not been allocated to other foreign countries and businesses. Certain
corporate services costs, previously included within North America, have been allocated to other foreign
countries and businesses. Prior period segment data has been recast within the tables below to conform to current
year presentation.
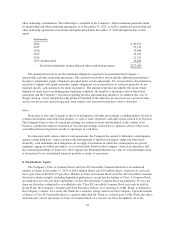
Year Ended December 31,
(In thousands) 2013 2012 2011
Net revenues
North America $2,193,739 $1,726,733 $1,383,346
Other foreign countries and businesses 138,312 108,188 89,338
Total net revenues $2,332,051 $1,834,921 $1,472,684
74