TCF Bank 2006 Annual Report Download - page 95
Download and view the complete annual report
Please find page 95 of the 2006 TCF Bank annual report below. You can navigate through the pages in the report by either clicking on the pages listed below, or by using the keyword search tool below to find specific information within the annual report.-
 1
1 -
2
-
3
-
4
-
5
-
6
-
7
-
8
-
9
-
10
-
11
-
12
-
13
-
14
-
15
-
16
-
17
-
18
-
19
-
20
-
21
-
22
-
23
-
24
-
25
-
26
-
27
-
28
-
29
-
30
-
31
-
32
-
33
-
34
-
35
-
36
-
37
-
38
-
39
-
40
-
41
-
42
-
43
-
44
-
45
-
46
-
47
-
48
-
49
-
50
-
51
-
52
-
53
-
54
-
55
-
56
-
57
-
58
-
59
-
60
-
61
-
62
-
63
-
64
-
65
-
66
-
67
-
68
-
69
-
70
-
71
-
72
-
73
-
74
-
75
-
76
-
77
-
78
-
79
-
80
-
81
-
82
-
83
-
84
-
 85
85 -
 86
86 -
 87
87 -
 88
88 -
 89
89 -
 90
90 -
 91
91 -
 92
92 -
 93
93 -
 94
94 -
 95
95 -
 96
96 -
 97
97 -
 98
98 -
 99
99 -
 100
100 -
 101
101 -
 102
102 -
 103
103 -
 104
104 -
 105
105 -
106
-
107
-
108
-
109
-
110
-
111
-
112
 |
 |

2006 Form10-K 75
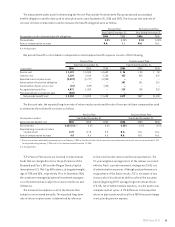
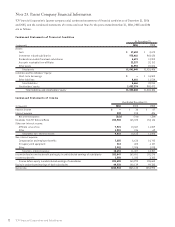
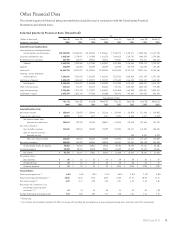
Other Financial Data
The selected quarterly financial data presented below should be read in conjunction with the Consolidated Financial
Statements and related notes.
Selected Quarterly Financial Data (Unaudited) At
(Dollars in thousands, Dec. 31, Sept. 30, June 30, March 31, Dec. 31, Sept. 30, June 30, March 31,
except per-share data) 2006 2006 2006 2006 2005 2005 2005 2005
Selected Financial Condition Data:
Loans and leases excluding education
and residential real estate loans $10,705,890 $10,496,031 $10,231,268 $ 9,824,661 $ 9,442,772 $ 9,159,271 $ 8,904,496 $ 8,619,770
Securities available for sale 1,816,126 1,770,427 1,781,995 1,816,135 1,648,615 1,318,787 1,406,575 1,785,520
Residential real estate loans 627,790 659,477 695,214 732,912 770,441 815,893 884,141 950,469
Subtotal 2,443,916 2,429,904 2,477,209 2,549,047 2,419,056 2,134,680 2,290,716 2,735,989
Goodwill 152,599 152,599 152,599 152,599 152,599 152,599 152,599 152,599
Total assets 14,669,734 14,319,387 14,222,561 13,851,936 13,388,594 12,761,770 12,637,616 12,755,354
Checking, savings and money
market deposits 7,285,615 7,224,223 7,261,327 7,461,186 7,213,735 7,012,038 6,721,399 6,727,189
Certificates of deposit 2,483,635 2,454,469 2,382,273 2,128,723 1,915,620 1,866,425 1,728,842 1,685,486
Total deposits 9,769,250 9,678,692 9,643,600 9,589,909 9,129,355 8,878,463 8,450,241 8,412,675
Short-term borrowings 214,112 376,397 561,374 346,528 472,126 1,084,933 1,045,582 878,390
Long-term borrowings 3,374,428 2,976,133 2,778,277 2,688,131 2,511,010 1,547,690 1,899,047 2,098,878
Stockholders’ equity 1,033,374 1,031,189 977,385 968,300 998,472 967,069 954,557 926,343
Three Months Ended
Dec. 31, Sept. 30, June 30, March 31, Dec. 31, Sept. 30, June 30, March 31,
2006 2006 2006 2006 2005 2005 2005 2005
Selected Operations Data:
Net interest income $ 135,887 $ 135,033 $ 135,442 $ 131,168 $ 129,282 $ 128,070 $ 131,285 $ 129,053
Provision for credit losses 10,073 5,288 4,177 1,151 5,396 5,445 1,417 (3,672)
Net interest income after
provision for credit losses 125,814 129,745 131,265 130,017 123,886 122,625 129,868 132,725
Non-interest income:
Fees and other revenues 118,831 129,512 123,622 117,499 124,938 122,617 113,201 106,815
Gains on sales of securities
available for sale –– – – – 995 4,437 5,239
Total non-interest income 118,831 129,512 123,622 117,499 124,938 123,612 117,638 112,054
Non-interest expense 165,562 162,389 160,966 160,280 156,631 151,862 150,190 148,253
Income before income tax expense 79,083 96,868 93,921 87,236 92,193 94,375 97,316 96,526
Income tax expense 25,350 30,941 26,860 29,014 26,653 28,889 26,675 33,061
Net income $ 53,733 $ 65,927 $ 67,061 $ 58,222 $ 65,540 $ 65,486 $ 70,641 $ 63,465
Per common share:
Basic earnings $ .42 $ .51 $ .52 $ .45 $ .50 $ .50 $ .53 $ .47
Diluted earnings $ .42 $ .51 $ .52 $ .45 $ .50 $ .50 $ .53 $ .47
Dividends declared $ .23 $ .23 $ .23 $ .23 $ .2125 $ .2125 $ .2125 $ .2125
Financial Ratios:
Return on average assets (1) 1.49% 1.86% 1.92% 1.71% 2.01% 2.07% 2.22% 2.03%
Return on average common equity (1) 20.68 26.44 27.75 23.82 27.09 27.41 30.23 27.18
Net interest margin (1) 4.07 4.11 4.22 4.25 4.31 4.43 4.53 4.56
Net charge-offs (recoveries) as a
percentage of average loans
and leases (1) (2) .24 .18 .16 .08 .16 .93 .08 (.03)
Average total equity to average assets 7.20 7.02 6.92 7.18 7.40 7.56 7.36 7.48
(1) Annualized.
(2) For the three months ended September 30, 2005, net charge-offs excluding the leveraged lease as a percentage of average loans and leases were .08% (annualized).