TCF Bank 2006 Annual Report Download - page 56
Download and view the complete annual report
Please find page 56 of the 2006 TCF Bank annual report below. You can navigate through the pages in the report by either clicking on the pages listed below, or by using the keyword search tool below to find specific information within the annual report.-
 1
1 -
2
-
3
-
4
-
5
-
6
-
7
-
8
-
9
-
10
-
11
-
12
-
13
-
14
-
15
-
16
-
17
-
18
-
19
-
20
-
21
-
22
-
23
-
24
-
25
-
26
-
27
-
28
-
29
-
30
-
31
-
32
-
33
-
34
-
35
-
36
-
37
-
38
-
39
-
40
-
41
-
42
-
43
-
44
-
45
-
 46
46 -
 47
47 -
 48
48 -
 49
49 -
 50
50 -
 51
51 -
 52
52 -
 53
53 -
 54
54 -
 55
55 -
 56
56 -
 57
57 -
 58
58 -
 59
59 -
 60
60 -
 61
61 -
 62
62 -
 63
63 -
 64
64 -
 65
65 -
 66
66 -
67
-
68
-
69
-
70
-
71
-
72
-
73
-
74
-
75
-
76
-
77
-
78
-
79
-
80
-
81
-
82
-
83
-
84
-
85
-
86
-
87
-
88
-
89
-
90
-
91
-
92
-
93
-
94
-
95
-
96
-
97
-
98
-
99
-
100
-
101
-
102
-
103
-
104
-
105
-
106
-
107
-
108
-
109
-
110
-
111
-
112
 |
 |

Liquidity Management TCF manages its liquidity
position to ensure that the funding needs of depositors and
borrowers are met promptly and in a cost-effective manner.
Asset liquidity arises from the ability to convert assets to
cash as well as from the maturity of assets. Liability liquid-
ity results from the ability of TCF to attract a diversity of
funding sources to promptly meet funding requirements.
Deposits are the primary source of TCF’s funds for use
in lending and for other general business purposes. In addi-
tion to deposits, TCF derives funds from loan and lease
repayments and borrowings. Deposit inflows and outflows
are significantly influenced by general interest rates, money
market conditions, competition for funds, customer service
and other factors. TCF’s deposit inflows and outflows have
been and will continue to be affected by these factors.
Borrowings may be used to compensate for reductions in
normal sources of funds, such as deposit inflows at less
than projected levels, net deposit outflows or to support
expanded activities. Historically, TCF has borrowed prima-
rily from the FHLB, from institutional sources under repur-
chase agreements and from other sources. At December 31,
2006, TCF had over $3.0 billion in unused capacity under
these funding sources, which could be used to meet future
liquidity needs. See “Borrowings.”
Potential sources of liquidity for TCF Financial Corporation
(parent company only) include cash dividends from TCF
Bank, issuance of debt and equity securities and borrowings
under a $105 million line of credit. TCF Bank’s ability to pay
dividends or make other capital distributions to TCF is
restricted by regulation and may require regulatory approval.
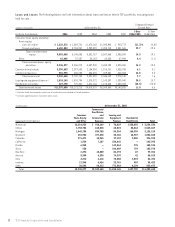
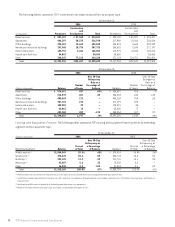
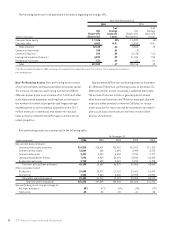
Deposits Deposits totaled $9.8 billion at December 31,
2006, up $639.9 million from December 31, 2005. Checking,
savings and money market deposits are an important
source of low-cost funds and fee income for TCF. Checking,
savings and money market deposits totaled $7.3 billion, up
$72 million from December 31, 2005, and comprised 75% of
total deposits at December 31, 2006, compared with 79%
of total deposits at December 31, 2005. The average balance
of these deposits for 2006 was $7.1 billion, an increase of
$378 million over the $6.7 billion average balance for 2005.
Certificates of deposit totaled $2.5 billion at December 31,
2006, up $568 million from December 31,2005. TCF had
no brokered deposits at December 31, 2006 or 2005. Non-
interest bearing deposits represented 25% and 27% of total
deposits as of December 31, 2006 and 2005, respectively.
TCF’s weighted-average cost for deposits, including non-
interest bearing deposits, was 2.33% at December 31, 2006,
up from 1.64% at December 31, 2005, primarily reflecting
increases in Premier checking, Premier savings and certifi-
cates of deposit average balances and overall increases in
interest rates.
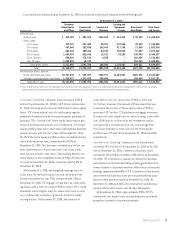
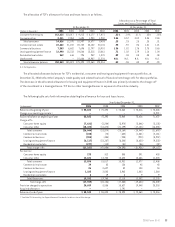
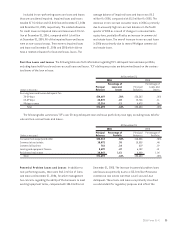
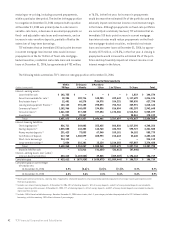
Potential problem loans and leases are summarized as follows.
At December 31,
2006 2005
Principal Percentage of Principal Percentage of
(Dollars in thousands) Balances Portfolio Balances Portfolio
Commercial real estate $43,216 1.81% $35,341 1.54%
Commercial business 11,664 2.11 11,793 2.71
Leasing and equipment finance 11,265 .62 7,648 .51
Total $66,145 .58 $54,782 .54
36 TCF Financial Corporation and Subsidiaries
distinct possibility, but not the probability, that the
Company will not be able to collect all amounts due
according to the contractual terms of the loan or lease
agreement. Although these loans and leases have been
identified as potential problem loans and leases, they
may never become delinquent, non-performing or impaired.
Additionally, these loans and leases are generally secured
by commercial real estate or other assets, thus reducing
the potential for loss should they become non-performing.
Potential problem loans and leases are considered in the
determination of the adequacy of the allowance for loan
and lease losses. None of the leasing and equipment finance
potential problem loans at December 31, 2006 and 2005,
respectively, were funded on a non-recourse basis.