TCF Bank 2006 Annual Report Download - page 41
Download and view the complete annual report
Please find page 41 of the 2006 TCF Bank annual report below. You can navigate through the pages in the report by either clicking on the pages listed below, or by using the keyword search tool below to find specific information within the annual report.-
 1
1 -
2
-
3
-
4
-
5
-
6
-
7
-
8
-
9
-
10
-
11
-
12
-
13
-
14
-
15
-
16
-
17
-
18
-
19
-
20
-
21
-
22
-
23
-
24
-
25
-
26
-
27
-
28
-
29
-
30
-
 31
31 -
 32
32 -
 33
33 -
 34
34 -
 35
35 -
 36
36 -
 37
37 -
 38
38 -
 39
39 -
 40
40 -
 41
41 -
 42
42 -
 43
43 -
 44
44 -
 45
45 -
 46
46 -
 47
47 -
 48
48 -
 49
49 -
 50
50 -
 51
51 -
52
-
53
-
54
-
55
-
56
-
57
-
58
-
59
-
60
-
61
-
62
-
63
-
64
-
65
-
66
-
67
-
68
-
69
-
70
-
71
-
72
-
73
-
74
-
75
-
76
-
77
-
78
-
79
-
80
-
81
-
82
-
83
-
84
-
85
-
86
-
87
-
88
-
89
-
90
-
91
-
92
-
93
-
94
-
95
-
96
-
97
-
98
-
99
-
100
-
101
-
102
-
103
-
104
-
105
-
106
-
107
-
108
-
109
-
110
-
111
-
112
 |
 |

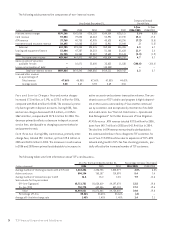
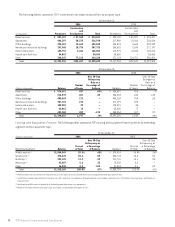
2006 Form10-K
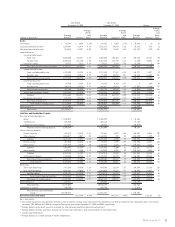
Year Ended Year Ended
December 31, 2005 December 31, 2004 Change
Average
Average Average Yields
Yields Yields and
Average and Average and Average Rates
(Dollars in thousands) Balance Interest(1) Rates Balance Interest(1) Rates Balance Interest(1) (bps)
Assets:
Investments $ 95,349 $ 3,450 3.62% $ 124,833 $ 3,455 2.77% $ (29,484) $ (5) 85
Securities available for sale (2) 1,569,808 81,479 5.19 1,536,673 80,643 5.25 33,135 836 (6)
Education loans held for sale 214,588 10,921 5.09 331,529 11,533 3.48 (116,941) (612) 161
Loans and leases:
Consumer home equity:
Fixed-rate 2,304,340 154,241 6.69 1,509,055 104,494 6.92 795,285 49,747 (23)
Variable-rate 2,450,634 171,133 6.98 2,457,343 137,735 5.61 (6,709) 33,398 137
Consumer – other 34,763 3,213 9.24 39,161 3,210 8.20 (4,398) 3 104
Total consumer home equity and other 4,789,737 328,587 6.86 4,005,559 245,439 6.13 784,178 83,148 73
Commercial real estate:
Fixed- and adjustable-rate 1,385,905 85,214 6.15 1,237,634 77,187 6.24 148,271 8,027 (9)
Variable-rate 826,934 49,561 5.99 771,309 33,259 4.31 55,625 16,302 168
Total commercial real estate 2,212,839 134,775 6.09 2,008,943 110,446 5.50 203,896 24,329 59
Commercial business:
Fixed- and adjustable-rate 85,390 4,959 5.81 85,382 4,754 5.57 8 205 24
Variable-rate 340,314 19,575 5.75 346,411 13,815 3.99 (6,097) 5,760 176
Total commercial business 425,704 24,534 5.76 431,793 18,569 4.30 (6,089) 5,965 146
Leasing and equipment finance 1,423,264 97,596 6.86 1,285,925 89,364 6.95 137,339 8,232 (9)
Subtotal 8,851,544 585,492 6.61 7,732,220 463,818 6.00 1,119,324 121,674 61
Residential real estate 885,735 50,680 5.72 1,104,814 63,360 5.73 (219,079) (12,680) (1)
Total loans and leases(3) 9,737,279 636,172 6.53 8,837,034 527,178 5.97 900,245 108,994 56
Total interest-earning assets 11,617,024 732,022 6.30 10,830,069 622,809 5.75 786,955 109,213 55
Other assets(4) (5) 1,113,850 1,056,903 56,947
Total assets $12,730,874 $11,886,972 $ 843,902
Liabilities and Stockholders’ Equity:
Non-interest bearing deposits:
Retail $ 1,548,027 $ 1,504,392 $ 43,635
Small business 585,860 508,162 77,698
Commercial and custodial 311,497 342,446 (30,949)
Total non-interest bearing deposits 2,445,384 2,355,000 90,384
Interest-bearing deposits:
Premier checking 641,672 15,910 2.48 198,651 2,892 1.46 443,021 13,018 102
Other checking 1,026,017 2,067 .20 1,140,242 928 .08 (114,225) 1,139 12
Subtotal 1,667,689 17,977 1.08 1,338,893 3,820 .29 328,796 14,157 79
Premier savings 427,070 13,246 3.10 85,478 1,705 1.99 341,592 11,541 111
Other savings 1,558,423 9,419 .60 1,738,374 5,785 .33 (179,951) 3,634 27
Subtotal 1,985,493 22,665 1.14 1,823,852 7,490 .41 161,641 15,175 73
Money market 640,576 7,640 1.19 763,925 2,992 .39 (123,349) 4,648 80
Subtotal 4,293,758 48,282 1.12 3,926,670 14,302 .36 367,088 33,980 76
Certificates of deposit 1,740,440 49,124 2.82 1,493,938 28,279 1.89 246,502 20,845 93
Total interest-bearing deposits 6,034,198 97,406 1.61 5,420,608 42,581 .79 613,590 54,825 82
Total deposits 8,479,582 97,406 1.15 7,775,608 42,581 .55 703,974 54,825 60
Borrowings:
Short-term borrowings 917,665 29,830 3.25 809,106 12,664 1.57 108,559 17,166 168
Long-term borrowings 2,038,561 87,096 4.27 1,984,069 75,673 3.81 54,492 11,423 46
Total borrowings 2,956,226 116,926 3.96 2,793,175 88,337 3.16 163,051 28,589 80
Total interest-bearing liabilities 8,990,424 214,332 2.38 8,213,783 130,918 1.59 776,641 83,414 79
Total deposits and borrowings 11,435,808 214,332 1.87 10,568,783 130,918 1.24 867,025 83,414 63
Other liabilities(5) 349,216 374,409 (25,193)
Total liabilities 11,785,024 10,943,192 841,832
Stockholders’ equity(5) 945,850 943,780 2,070
Total liabilities and stockholders’
equity $12,730,874 $11,886,972 $ 843,902
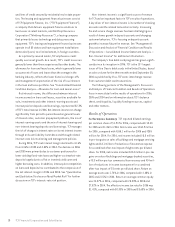
Net interest income and margin $517,690 4.46% $491,891 4.54% $ 25,799 (8)
bps = basis points.
(1) Tax-exempt income was not significant and thus yields on interest-earning assets and net interest margin have not been presented on a tax equivalent basis. Tax-exempt
income of $954,000 and $638,000 was recognized during the years ended December 31, 2005 and 2004, respectively.
(2) Average balance and yield of securities available for sale are based upon the historical amortized cost.
(3) Average balance of loans and leases includes non-accrual loans and leases, and is presented net of unearned income.
(4) Includes operating leases.
(5) Average balance is a simple average of month-end balances.
21