TCF Bank 2006 Annual Report Download - page 44
Download and view the complete annual report
Please find page 44 of the 2006 TCF Bank annual report below. You can navigate through the pages in the report by either clicking on the pages listed below, or by using the keyword search tool below to find specific information within the annual report.-
 1
1 -
2
-
3
-
4
-
5
-
6
-
7
-
8
-
9
-
10
-
11
-
12
-
13
-
14
-
15
-
16
-
17
-
18
-
19
-
20
-
21
-
22
-
23
-
24
-
25
-
26
-
27
-
28
-
29
-
30
-
31
-
32
-
33
-
 34
34 -
 35
35 -
 36
36 -
 37
37 -
 38
38 -
 39
39 -
 40
40 -
 41
41 -
 42
42 -
 43
43 -
 44
44 -
 45
45 -
 46
46 -
 47
47 -
 48
48 -
 49
49 -
 50
50 -
 51
51 -
 52
52 -
 53
53 -
 54
54 -
55
-
56
-
57
-
58
-
59
-
60
-
61
-
62
-
63
-
64
-
65
-
66
-
67
-
68
-
69
-
70
-
71
-
72
-
73
-
74
-
75
-
76
-
77
-
78
-
79
-
80
-
81
-
82
-
83
-
84
-
85
-
86
-
87
-
88
-
89
-
90
-
91
-
92
-
93
-
94
-
95
-
96
-
97
-
98
-
99
-
100
-
101
-
102
-
103
-
104
-
105
-
106
-
107
-
108
-
109
-
110
-
111
-
112
 |
 |

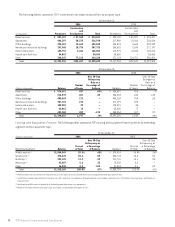
Fees and Service Charges Fees and service charges
increased $7.5 million, or 2.9%, to $270.2 million for 2006,
compared with $262.6 million for 2005. The increase is prima-
rily due to growth in deposit accounts. During 2005, fees
and service charges decreased $12.5 million, or 4.5% to
$262.6 million, compared with $275.1 million for 2004. This
decrease primarily reflects a decrease in deposit account
service fees, attributable to changing customer behavior
and payment trends.
Card Revenue During 2006, card revenue, primarily inter-
change fees, totaled $92.1 million, up from $79.8 million in
2005 and $63.5 million in 2004. The increases in card revenue
in 2006 and 2005 were primarily attributable to increases in
active accounts and customer transaction volumes. The con-
tinued success of TCF’s debit card program is highly depend-
ent on the success and viability of Visa and the continued
use by customers and acceptance by merchants of its debit
and credit cards. See “Item 1A. Risk Factors – Operational
Risk Management” for further discussion of Visa litigation.
ATM Revenue ATM revenue totaled $37.8 million for 2006,
down from $40.7 million in 2005 and $42.9 million in 2004.
The declines in ATM revenue were primarily attributable to
the continued declines in fees charged to TCF customers for
use of non-TCF ATM machines due to expansion of TCF’s ATM
network and growth in TCF’s fee free checking products, par-
tially offset by the increased number of TCF customers.
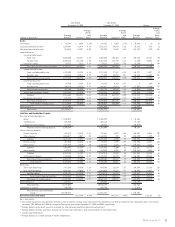
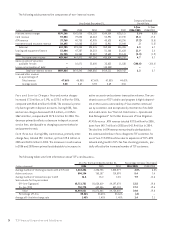
The following table sets forth information about TCF’s card business.
At or For the Year Ended December 31, Percentage Increase (Decrease)
(Dollars in thousands) 2006 2005 2004 2006/2005 2005/2004
Average number of checking accounts with a TCF card 1,463,456 1,406,728 1,323,877 4.0% 6.3%
Active card users 804,194 763,157 710,893 5.4 7.4
Average number of transactions per month 16.4 15.2 13.5 7.9 12.6
Sales volume for the year ended:
Off-line (Signature) $5,711,751 $5,030,619 $4,197,678 13.5 19.8
On-line (PIN) 752,770 642,446 537,124 17.2 19.6
Total $6,464,521 $5,673,065 $4,734,802 14.0 19.8
Percentage off-line 88.36% 88.68% 88.66% (.4) –
Average off-line interchange rate 1.45% 1.43% 1.40% 1.4 2.1
24 TCF Financial Corporation and Subsidiaries
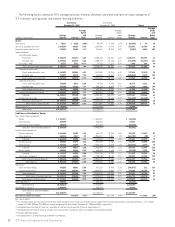
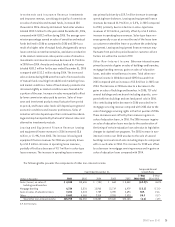
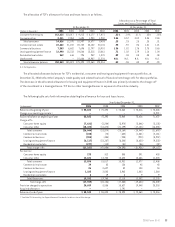
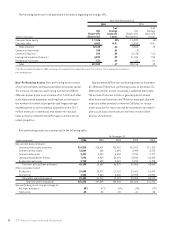
The following table presents the components of non-interest income.
Compound Annual
Year Ended December 31, Growth Rate
1-Year 5-Year
(Dollars in thousands) 2006 2005 2004 2003 2002 2006/2005 2006/2001
Fees and service charges $270,166 $262,636 $275,120 $249,339 $228,121 2.9% 6.3%
Card revenue 92,084 79,803 63,463 52,991 47,190 15.4 17.8
ATM revenue 37,760 40,730 42,935 43,623 45,296 (7.3) (3.8)
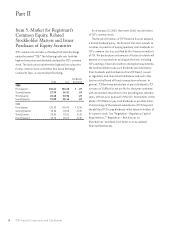
Investments and insurance revenue 10,695 10,665 12,558 13,901 15,848 .3 (1.5)
Subtotal 410,705 393,834 394,076 359,854 336,455 4.3 6.7
Leasing and equipment finance 53,004 47,387 50,323 51,088 51,628 11.9 3.0
Other 25,755 26,350 22,887 19,682 20,143 (2.3) (1.9)
Fees and other revenue 489,464 467,571 467,286 430,624 408,226 4.7 5.7
Gains on sales of securities
available for sale –10,671 22,600 32,832 11,536 (100.0) (100.0)
Losses on termination of debt –– – (44,345) – ––
Total non-interest income $489,464 $478,242 $489,886 $419,111 $419,762 2.3 5.7
Fees and other revenue
as a percentage of:
Total revenue 47.66% 46.95% 47.60% 47.83% 44.42%
Average assets 3.48 3.67 3.93 3.69 3.51